
Extended Data Figure 3. Cryo-EM analysis of the chimeric Sec complex in an inhibitor (apratoxin F)-bound form.
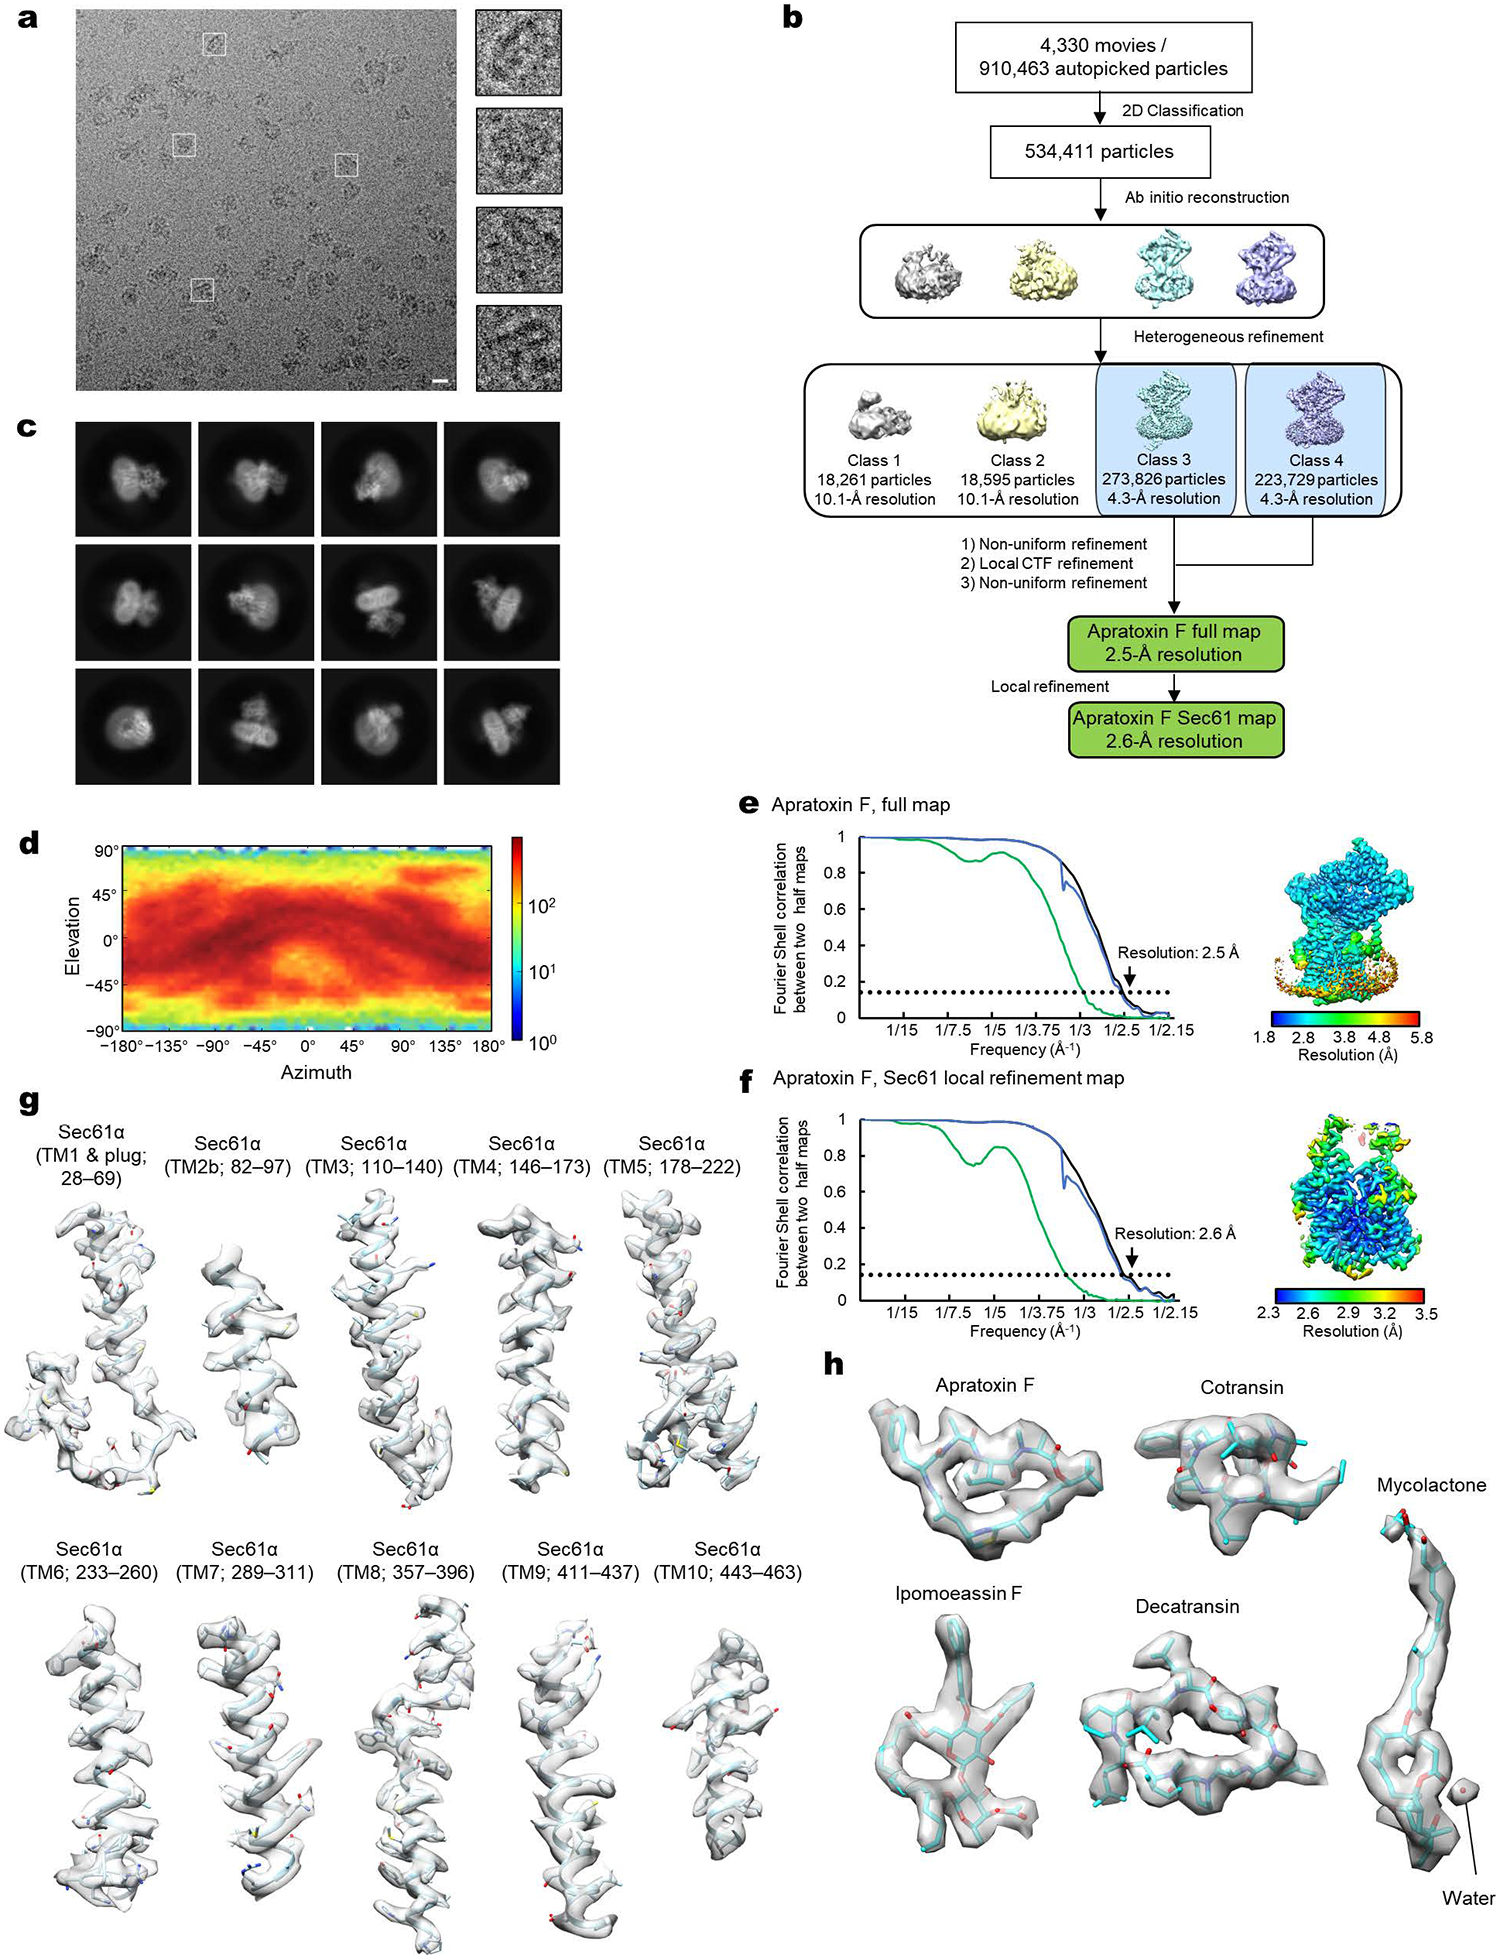
a, Images of a representative micrograph and particles of the apratoxin F-bound chimeric Sec complex. Scale bar, 10 nm. b, A schematics of the cryo-EM analysis of the apratoxin F-bound chimeric Sec complex. c, Representative 2D classes of the apratoxin F-bound Sec complex. d, Distribution of particle view orientations in the final reconstruction. e, The FSC curve and local resolution map of the final reconstruction (full Sec complex map). f, As in e, but for the map from focused (local) refinement. g, Segmented density maps of the apratoxin F-bound Sec61α subunit. h, Segmented density features of bound natural inhibitors.