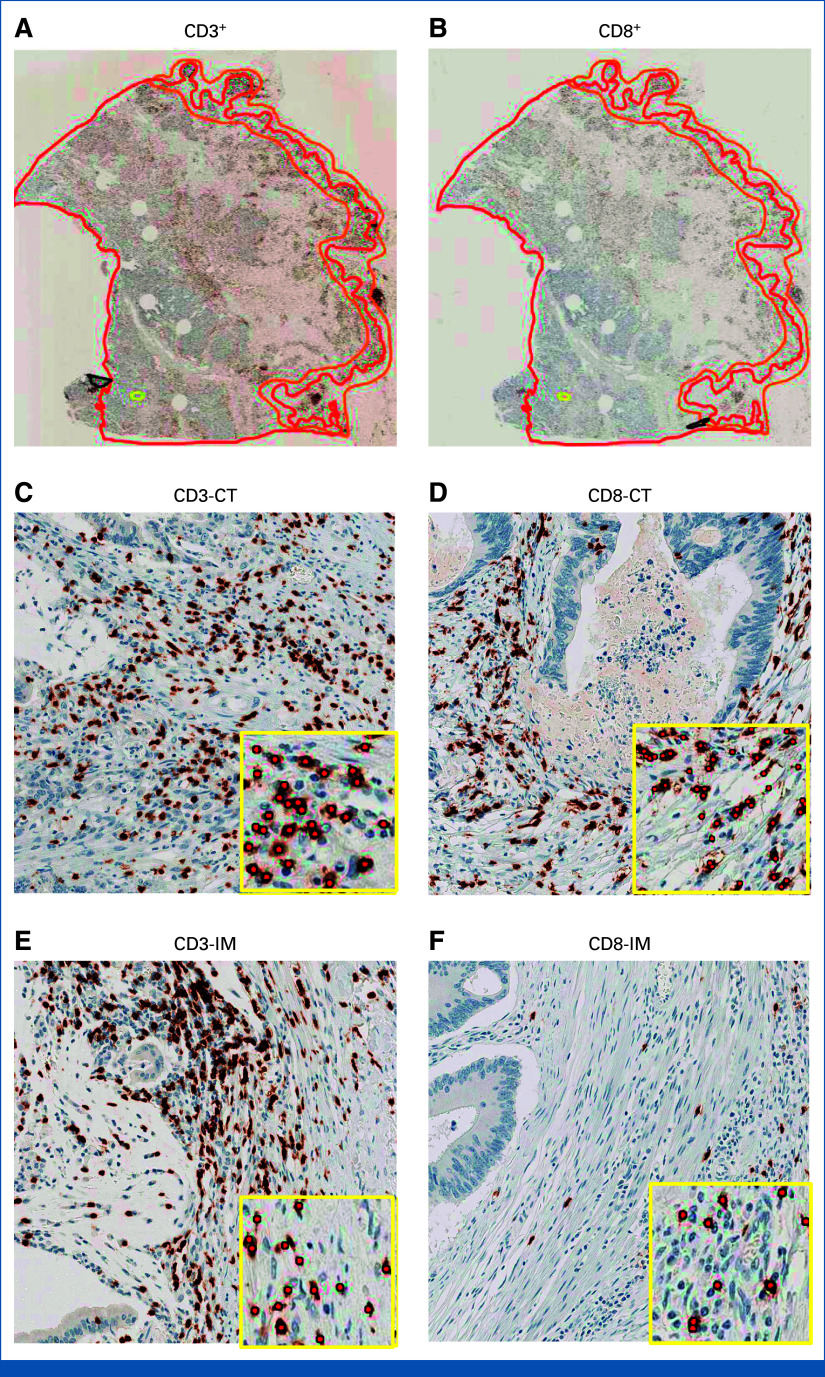
FIG 2.
Representative IHC images of CD3+ and CD8+ T-cells in the tumor microenvironment of colon cancer—(A) CD3-stained whole tissue sections were manually annotated to outline the CT (red line) and the IM (orange line); (B) CT and IM annotations were transferred onto adjacent CD8-stained sections through an image registration algorithm; (A and B) whole tissue sections and (C-F) magnified regions are shown. Insets show algorithmic cell-by-cell classification of CD3+ and CD8+ T-cells (red dots). T-cell densities were quantified (cells/mm2) for each marker in each region. CT, core tumor; IHC, immunohistochemical; IM, invasive margin.

