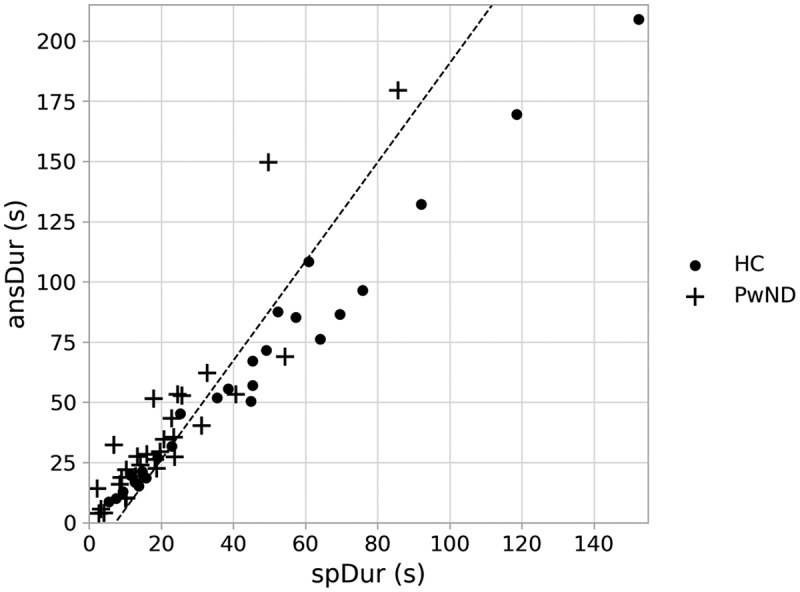
Figure 5.

A scatter plot visualisation of the duration of speech (spDur) and total duration of the response (ansDur) for healthy control participants (HC) and people with diagnosed early stage neurodegenerative disorders (PwND). The linear decision boundary generated by the Logistic regression model is represented by the diagonal line within the plot. Data points to the right of the line will receive a prediction of HC. Data points to the left of the line will receive a prediction of neurodegenerative disorder.
