Figure 6.

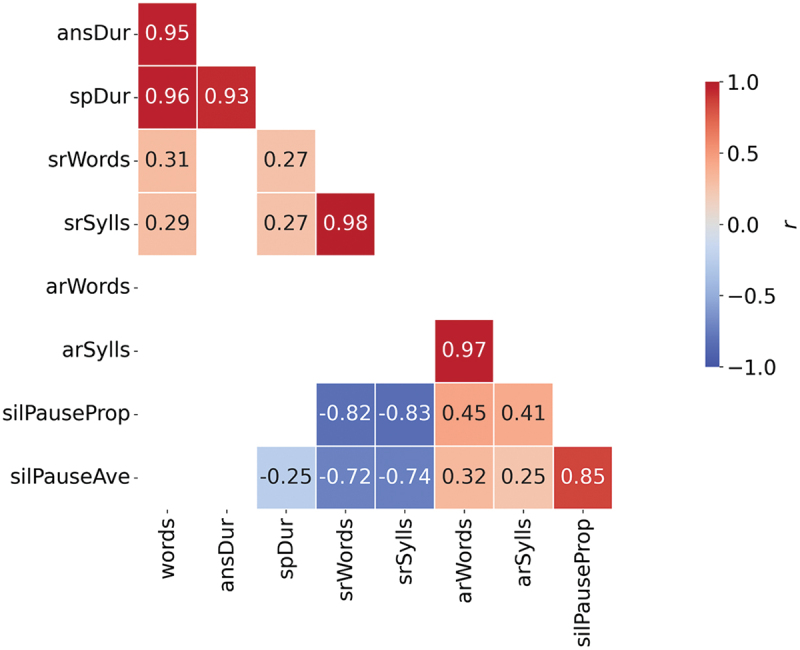
Correlation matrix for all variables, all participants combined (n = 64). Cells in the matrix show values for Pearson’s correlation coefficient r where p < 0.05.

Correlation matrix for all variables, all participants combined (n = 64). Cells in the matrix show values for Pearson’s correlation coefficient r where p < 0.05.