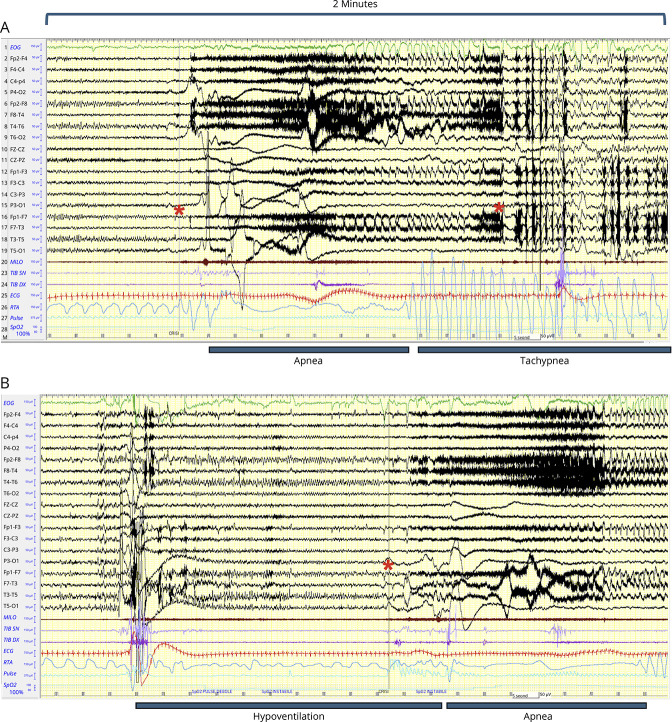
Figure 2. Polygraphic Features of Ictal Apnea in Patient 1.
In both A and B, 2 minutes of long-term EEG monitoring are shown for 2 seizures. (A) Regular breathing (RTA channel) is interrupted with the appearance of a prolonged apnea (>30 s). Red asterisks mark the start and termination of the ictal discharge on scalp EEG. The apnea was followed by a marked tachypnea with gasping that started during the seizure then prolonging into the postictal period for several seconds. ECG shows tachycardia during the apnea persisting in the postictal period. The EEG channels show EMG artifacts during the first part of the seizure; then, a generalized EEG suppression with anterior slow waves is evident in the second part of the seizure and in the postictal period. Oxygen saturation is 100% at seizure onset; then, a decrease is observed until 74%. (B) A second seizure with a similar sequence is reported. However, in this ictal event, the apnea period is preceded by a prolonged period of hypoventilation that precedes the EEG seizure onset (red asterisk). This event was more prolonged and associated with an oxygen desaturation until 71%. The end of the seizure and the postictal period are not shown. EEG channels show bipolar recordings according to the 10–20 international system. Filters: high-pass 0.1 Hz; low-pass 35 Hz. Amplitude 10 uV/mm. Polygraphic channels are as follows: channel 1: ocular movement (green color); channel 20 (milo): EMG activity from mylohyoid muscle (brown color); channels 23–24 (tib dx, tib sx): EMG activity from right and left tibialis anterior muscles (purple color); channel 25 (ECG): cardiac activity (red color); channel 26 (RTA): thoracoabdominal respiration (blue). The last 2 channels: pulse and oxygen saturation (light blue).

