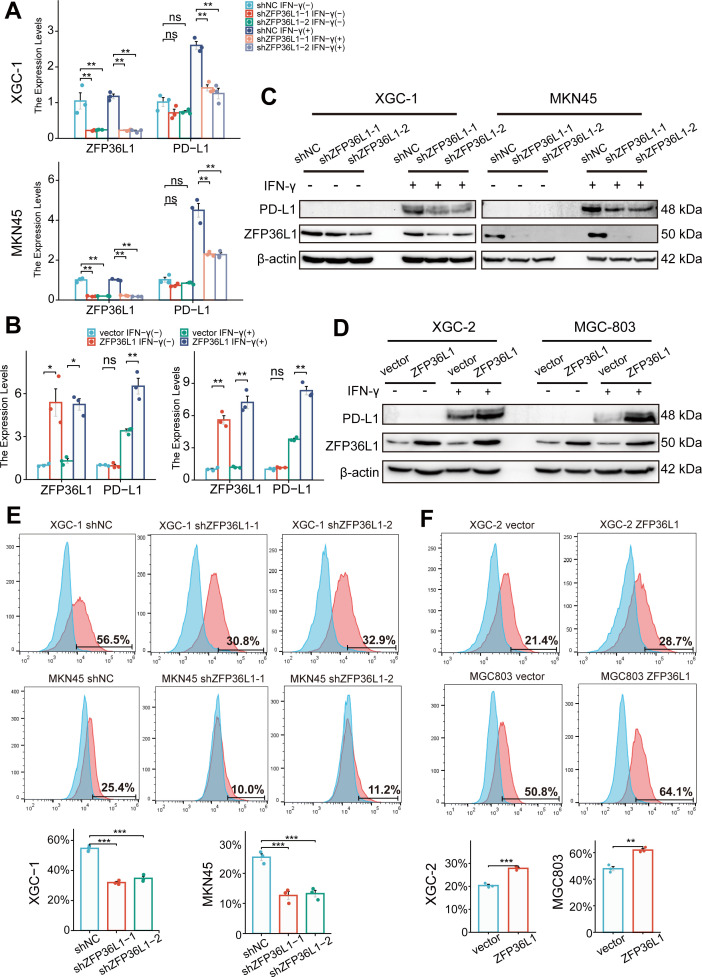
Figure 3. ZFP36L1 promotes IFN-γ-induced PD-L1 expression.
(A) mRNA and (C) protein expression of PD-L1 in gastric cancer (GC) cell lines with or without ZFP36L1 knockdown (n=3). (B) mRNA and (D) protein expression of PD-L1 in GC cell lines with or without ZFP36L1 overexpression (n=3). Fluorescent signal of the PD-L1 membrane protein in GC cell lines with or without ZFP36L1 (E) knockdown and (F) overexpression (n=3). ***, p<0.001; **, p<0.01; *, p<0.05; ns, p≥0.05. (A–B) Welch’s ANOVA with a Games-Howell post hoc test, (E) one-way ANOVA post hoc Tukey HSD, and (F) t-test were used for statistical analysis.

