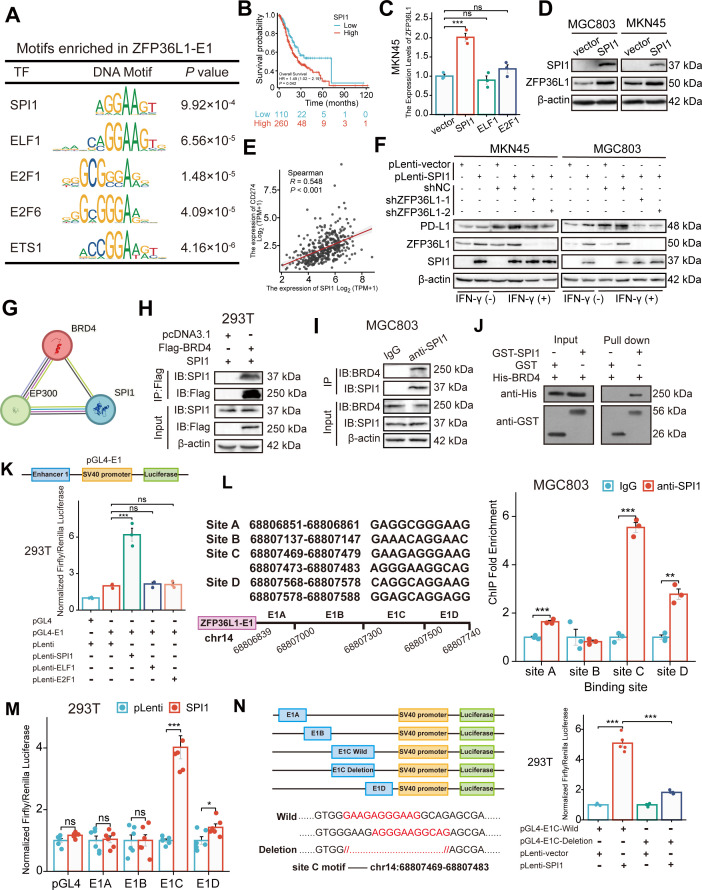
Figure 4. SPI1 binds to the ZFP36L1-SE region and drives the regulation of PD-L1.
(A) Schematic of transcription factor (TF) motif enrichment in ZFP36L1-E1. (B) Kaplan-Meier survival plot of SPI1 in The Cancer Genome Atlas (TCGA). (C) The mRNA expression of ZFP36L1 after TFs plasmid transfection (n=3). (D) The ZFP36L1 protein expression in cell lines overexpressing SPI1. (E) Correlation between SPI1 and PD-L1 mRNA expression in TCGA. (F) PD-L1 protein expression in simultaneous SPI1 overexpression and ZFP36L1 knockdown cells. (G) Prediction of SPI1-BRD4-P300 binding on the STRING website. Co-immunoprecipitation between (H) exogenous SPI1 and BRD4 in 293T cells, or (I) endogenous SPI1 and BRD4 in MGC803. (J) SPI1 directly interacts with BRD4 in vitro by GST pull-down experiment. (K) ZFP36L1-E1 binding of different TFs detected using dual-luciferase assay (n=3). (L) SPI1 enriched regions in ZFP36L1-E1 detected by chromatin immunoprecipitation (ChIP) assay (n=3). (M) Different binding sites of SPI1 in ZFP36L1-E1 detected using dual-luciferase assay (n=6). (N) Wild-type and motif-deletion mutant E1C binding of SPI1 detected using dual-luciferase (n=5). ***, p<0.001; **, p<0.01; *, p<0.05; ns, p≥0.05. (C ,K) One-way ANOVA post hoc Tukey HSD test, (L) t-test, (M) Welch’s t-test, and (N) Welch’s ANOVA with a Games-Howell post hoc test were used for statistical analysis.


