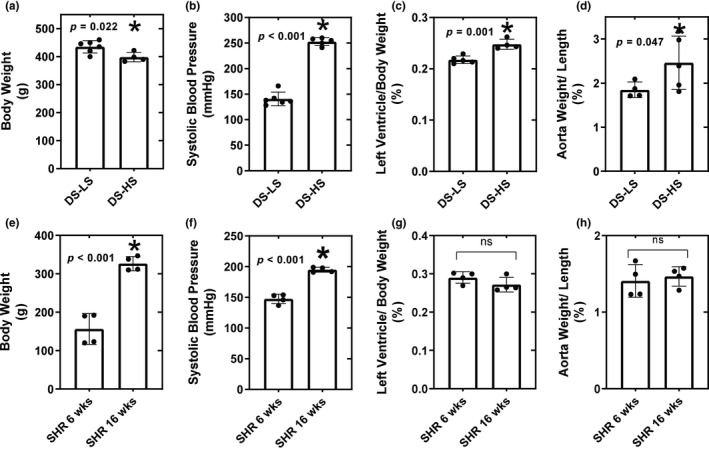
FIGURE 1.

Body weight; (a), systolic blood pressure; (b), left ventricle/body weight ratio; (c), and aorta weight/length; (d) for DS‐LS (n = 6) and DS‐HS (n = 5) rats. *p ≤ 0.05 versus DS‐LS. Body weight; (e), systolic blood pressure; (f), left ventricle/body weight ratio (g), and aorta weight/length (h) for SHR 6 week (n = 8) and SHR 16 week (n = 8). *p ≤ 0.05 versus SHR 6 week.
