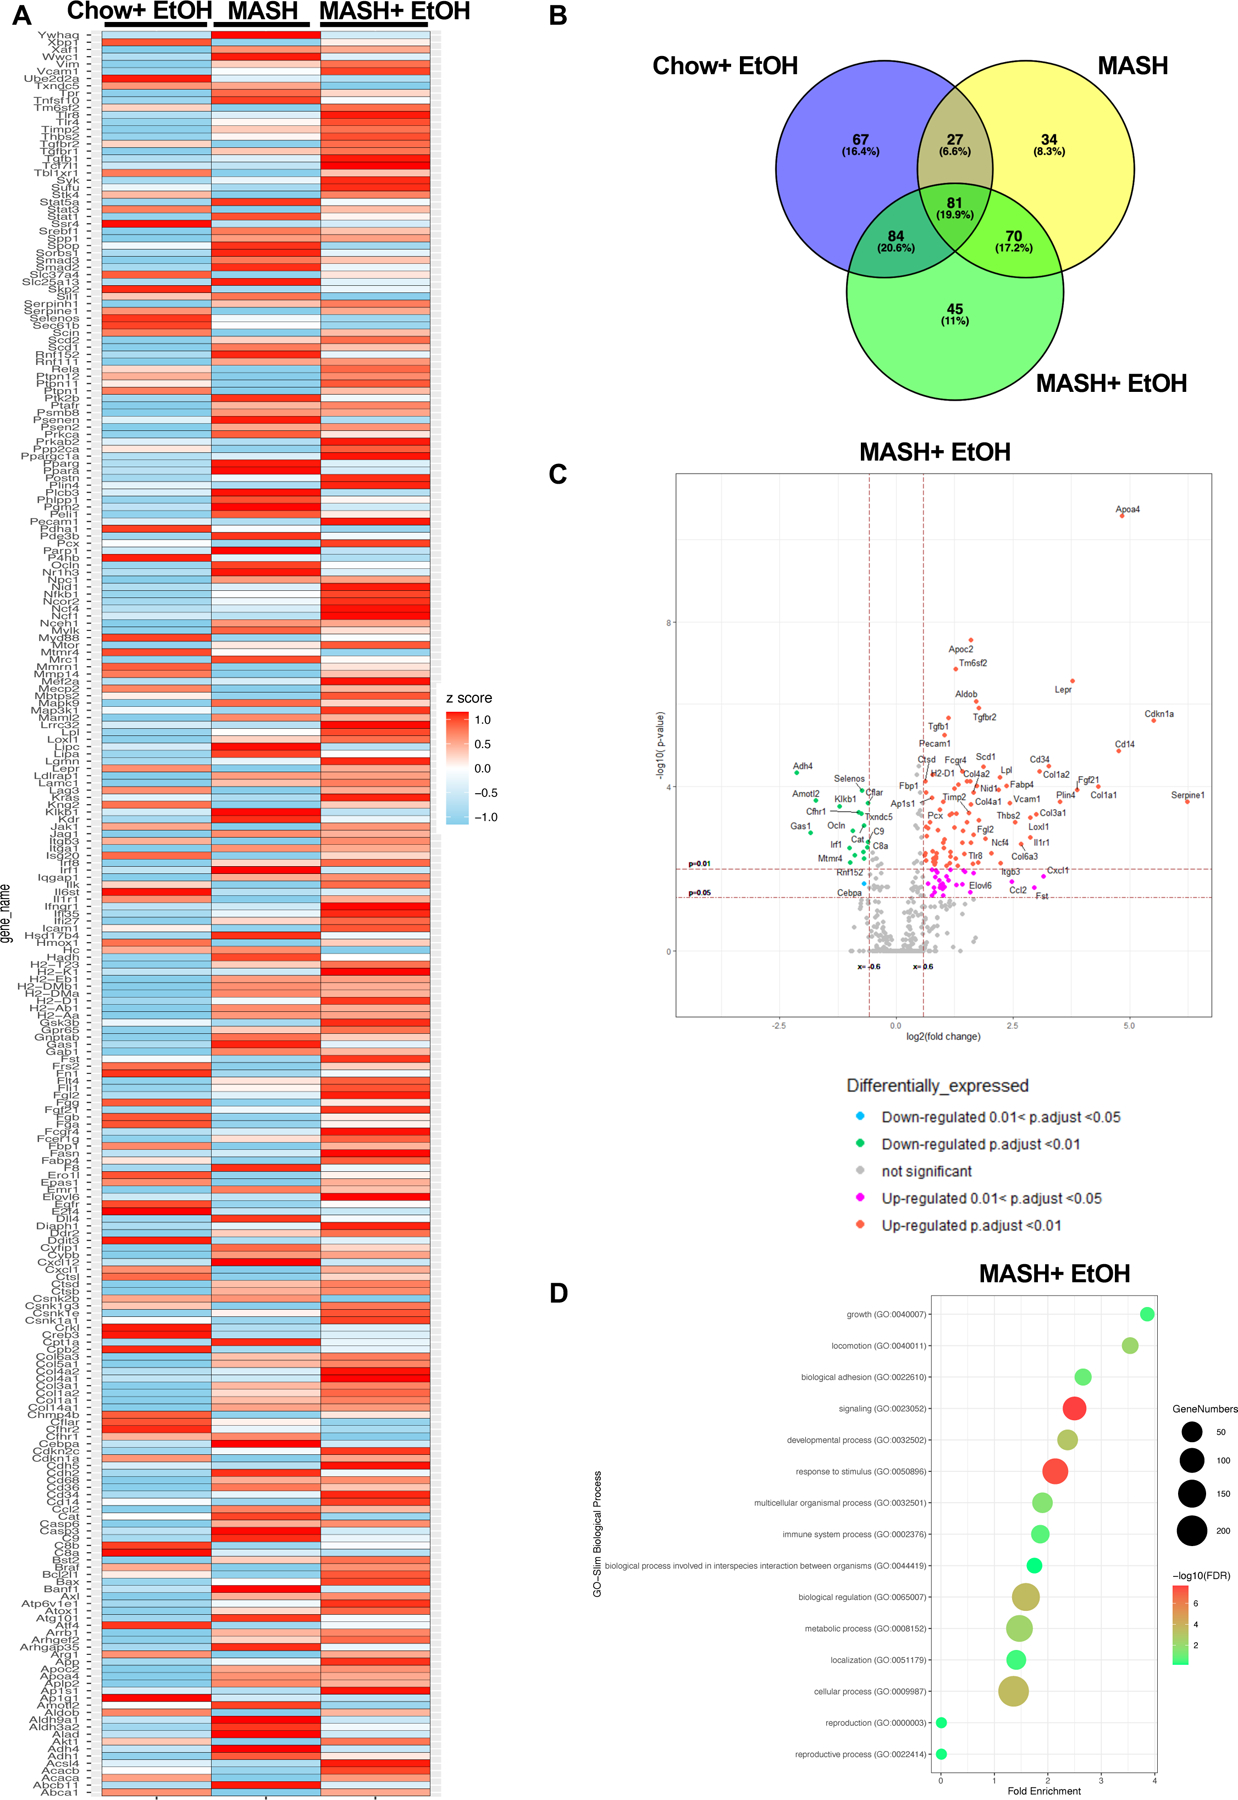
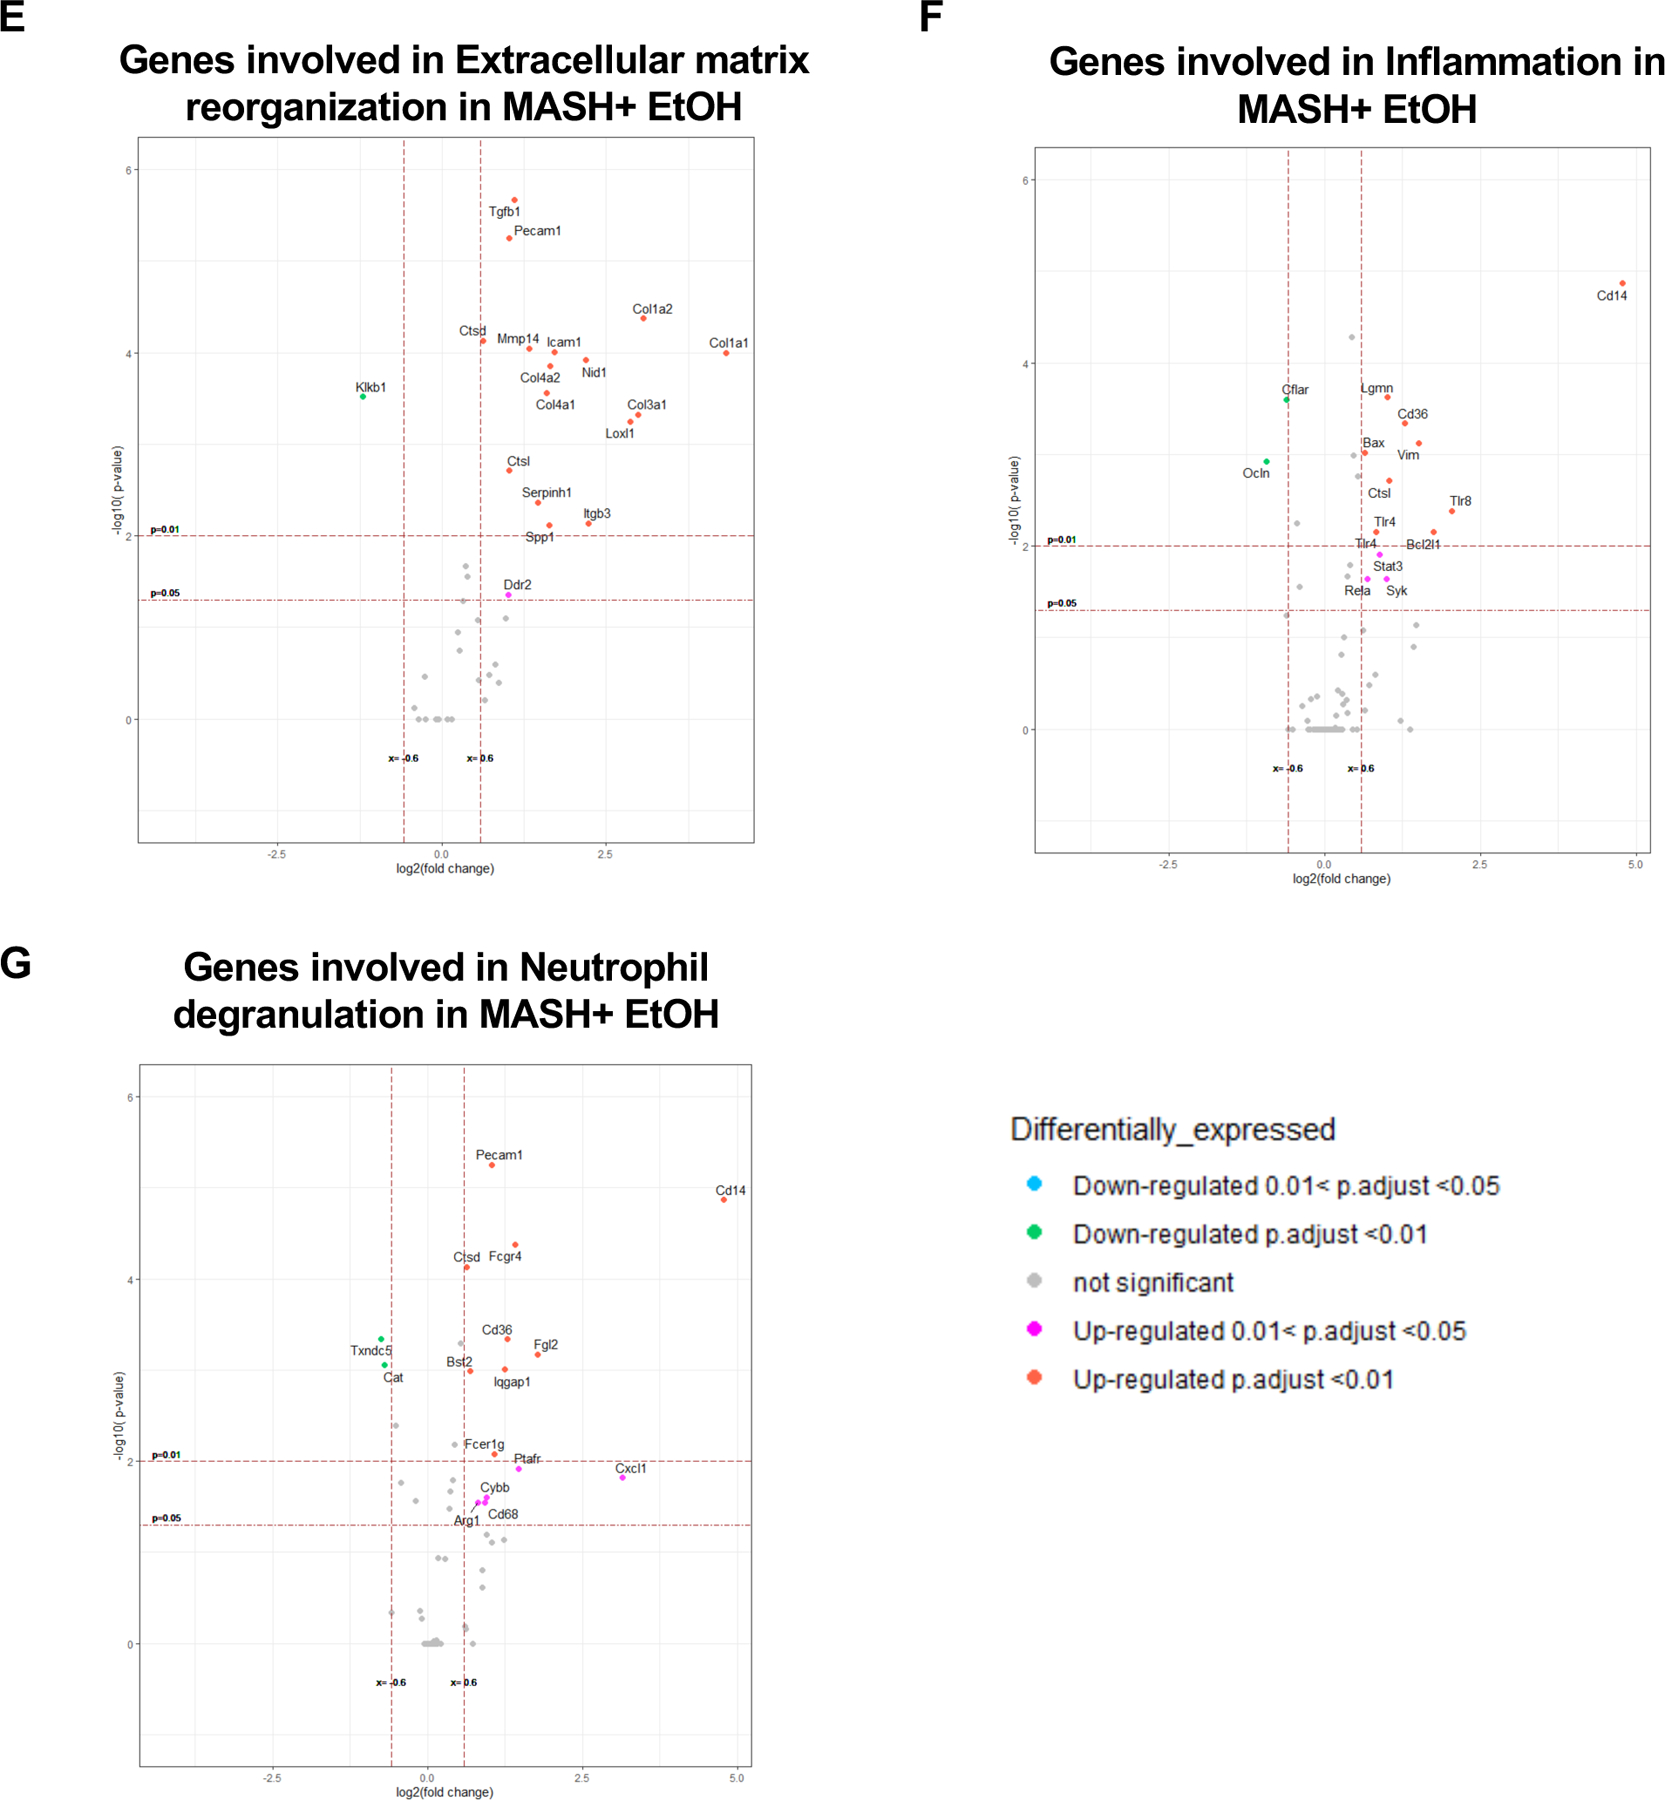
Fig 3. Differential expression of signaling pathways in MASH plus alcohol binges.


(A) Heatmap of differentially expressed genes (DEGs) in alcohol only, MASH only, and MASH plus alcohol with p≤0.05, and normalized to chow. (n=6mice/group). (B) Venn diagram showing the unique DEGs in each group as compared to chow. (C) Volcano plot depicting DEGs in MASH plus alcohol. (D) Bubble plot depicting GO term analysis of the biological process. Volcano plot depicting DEGs involved in extracellular matrix reorganization (E), inflammation (F), and neutrophil degranulation (G) in MASH plus alcohol as compared to chow.
