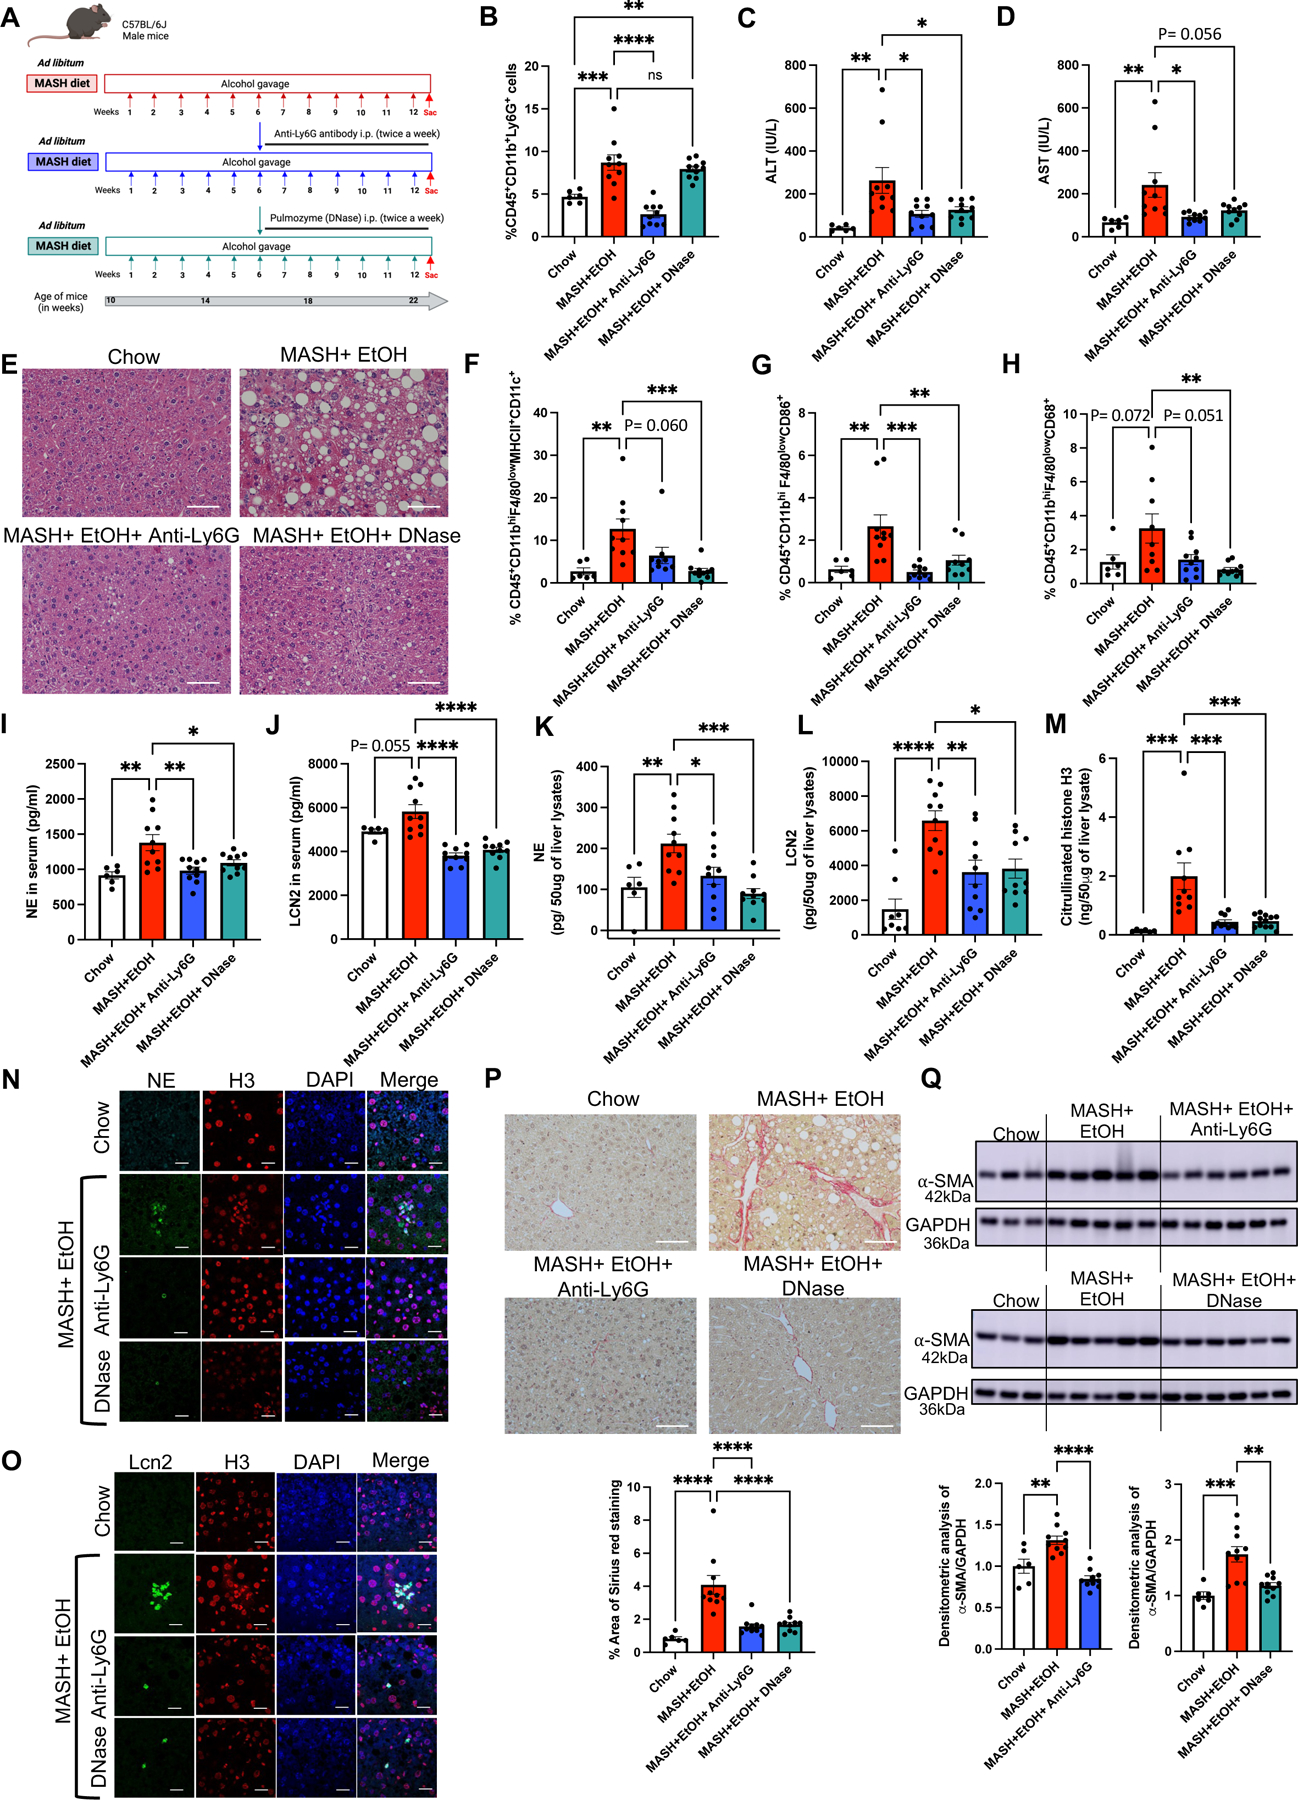
Fig 7. Depletion of neutrophils and disruption of NETs by DNase ameliorate liver damage and fibrosis in combined liver injury by alcohol binges and MASH.

(A) Feeding schematics for combined liver injury with a therapeutic intervention of anti-Ly6G antibody and DNase treatment as described in Methods section. (B) Flow cytometry analysis of neutrophils (CD45+CD11b+Ly6G+) in liver immune cells. (C-D). ALT & AST levels were measured from serum. (E) Formalin-fixed liver sections were stained with Hematoxylin and eosin representative slides are shown, scale bar =50 μm. (F-H) Flow cytometry analysis of monocyte-derived macrophages, (CD45+CD11bhiF4/80lowMHCII+CD11c+, CD45+CD11bhiF4/80lowCD86+, CD45+CD11bhiF4/80lowCD68+). Levels of NE (I), and LCN2 (J), in serum as measured by ELISA. Whole-cell liver lysates were used to detect NE (K), LCN2 (L), and Cit-H3 (M) by ELISA. Co-immunofluorescence staining with NE and Histone H3 (N) and with LCN2 and Histone H3 (O) to visualize NETs production in mouse liver. scale bar=50 μm. (P) Formalin-fixed liver sections were stained with Sirius red stain, and representative slides are shown. (n=6–10 mice/group and average of 3–5 images per mice). Scale bar=50 μm. The percentage area of Sirius red staining is quantified using Image J. (Q) Liver lysates were analyzed by western blotting for α-SMA, using GAPDH as a loading control. The densitometric analysis of α-SMA is shown as bar graph. * p<0.05, **p<0.005, ***p<0.0005, ****p<0.00005 (n=6mice/chow group and n=10mice/all other group).
