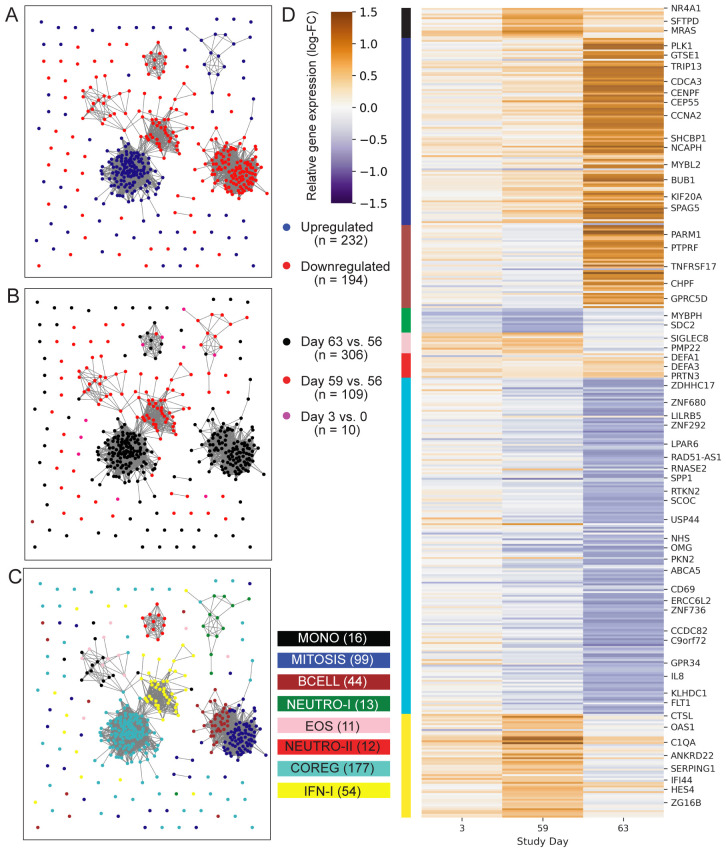
Figure 2.
Profile of ID93+GLA-SE differentially expressed genes. Network plots represent 426 genes (nodes) that were differentially expressed after ID93+GLA-SE vaccination. Significant differential expression was based on an unadjusted-p < 0.05, FDR-adjusted q-value < 0.2 and absolute-log2 fold-change > 0.5. Edges connecting nodes represent a positive rank correlation with R > 0.6 (edge length does not convey additional information). Node color indicates (A) up- (red) vs. down- (blue) regulation relative to pre-vaccination, (B) differential regulation at one of three time points: days 3 vs. 0 (pink), 59 vs. 56 (red) or 63 vs. 56 (black), or (C) membership in one of eight gene modules created using WGCNA. Genes that were differentially expressed at more than one time point are colored for the time point with the largest fold-change, therefore there are fewer genes plotted than total DEGs stated in results. Each gene is in exactly one module. (D) Heatmap indicates log-transformed fold-change for each differentially expressed gene, relative to the most recent vaccine dose (either day 0 or day 56). Module membership is indicated by the color bar. A subset of genes are labeled by gene symbol including some of those cited in the text or found in gene sets that were significantly enriched with DEGs in the GSEA analysis.

