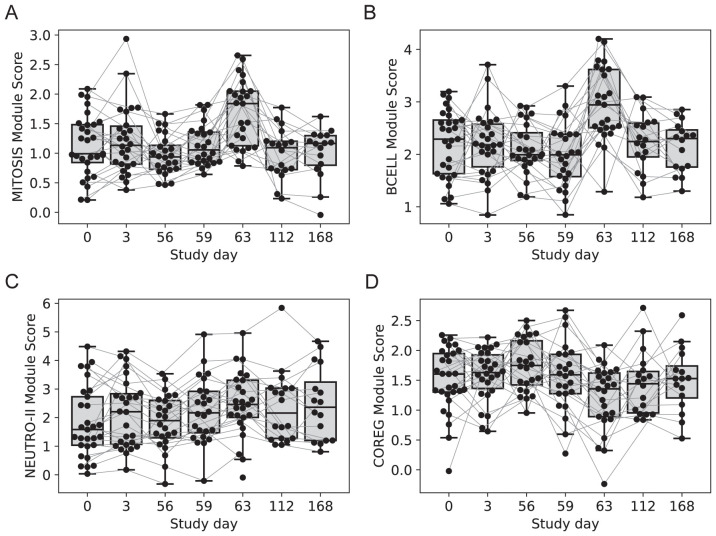
Figure 4.
Longitudinal expression of modules with changes 7-days post-vaccination. Boxplots of the eigengene expression score for each participant in either the 2-dose or 3-dose “2 + 5” ID93+GLA-SE vaccine group (n=29). (A) MITOSIS module, (B) BCELL module, (C) NEUTRO-II module, (D) COREG module. A line for each participant is overlaid, connecting longitudinal observations. Box extents indicate the interquartile range (IQR) with whiskers indicating the extent of the most extreme observation within1.5-times the IQR.

