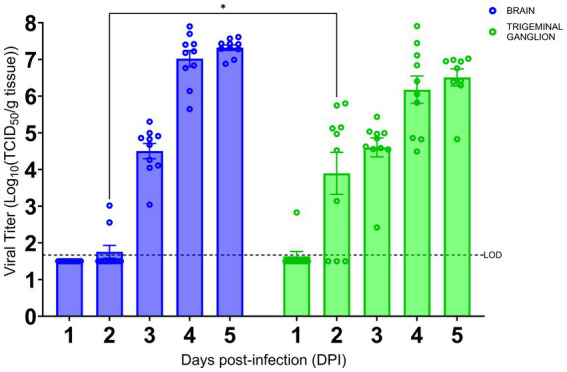
Figure 3.

SARS-CoV-2 replication kinetics in the trigeminal ganglion and the brain. The titers of infectious virus in brain and TG were calculated and expressed as log10 TCID50 virus per gram of tissue and were plotted as the mean of two different cohorts (n = 10 animals per timepoint). Virus titers in the brain (blue) and TG (green) were assessed using a standard Vero-E6 cell-based TCID50 assay. * p < 0.05, by Student’s t-test, comparing brain and TG. Error bars represent standard errors of the mean (SEM). These were the combined data of two different independent experiments.
