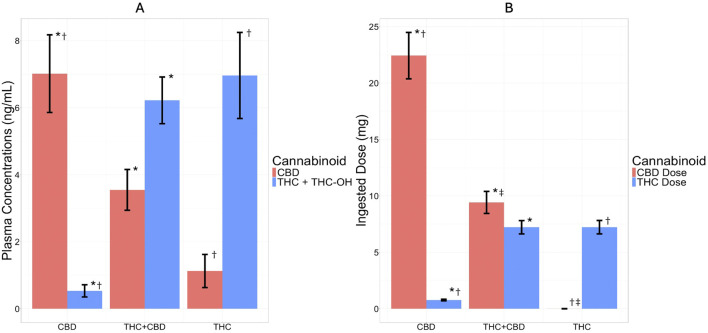
FIGURE 3.
Plasma Concentrations (ng/mL) and Ingested Dose (mg) by Cannabis Product Group (CBD, THC + CBD, and THC) During Acute Mobile Laboratory Session. The bar graph depicts cannabidiol (CBD) plasma concentration and dose in red and tetrahydrocannabinol (THC) plus the blood THC metabolite 11-Hydroxy-Δ9-THC (11-OH-THC) plasma concentration and THC dose in blue for each cannabis product group. (A) Plasma concentration (ng/mL) of CBD and THC + THC-OH by product group at 1-h post-use and (B) CBD and THC ingested doses (mg) by product group during the acute use timepoint. Bars are graphed as ± mean (standard deviation). * = significant (p < 0.001) group difference between the CBD and THC + CBD groups, † = significant (p < 0.001) group difference between the CBD and THC groups, ‡ = significant (p < 0.01) group difference between the THC + CBD and THC groups. For cannabinoid exposure as measured by plasma concentrations (ng/mL), it was found that after acute cannabis use there was an expected and significant group by time interaction such that THC exposure (THC +11-OH-THC) was greater among the THC and THC + CBD groups compared to CBD, and CBD was greater within the CBD group compared to the THC and THC + CBD groups. In regard to ingested dose, these results also followed expected patterns by group such that the THC ingested dose was lower for the CBD group compared to both the THC + CBD and THC groups; the CBD ingested dose was greater for the CBD group compared to the THC + CBD and THC groups; and the CBD ingested dose was greater for the THC + CBD group compared to the THC group.

