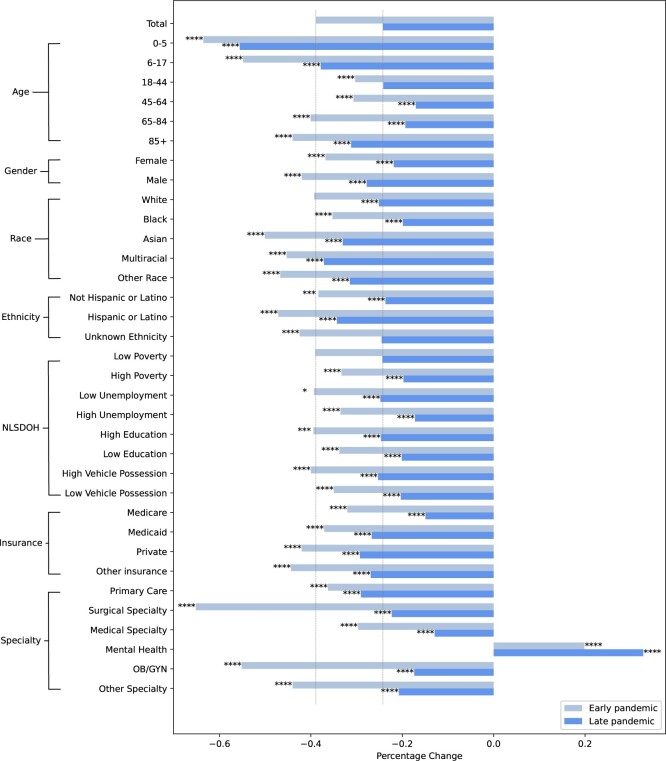
Figure 1.
Changes in patient-provider visits by health equity determinant groups during the early and late pandemic periods. (1) Unknown, binary, other gender, and self-pay insurance status groups are not shown due to their small sample sizes. (2) The pale gray vertical line shows the percentage changes for the total group for ease of comparison. (3) Significance levels: *P-value < .05, **P-value < .01, ***P-value < .005, ****P-value < .001.

