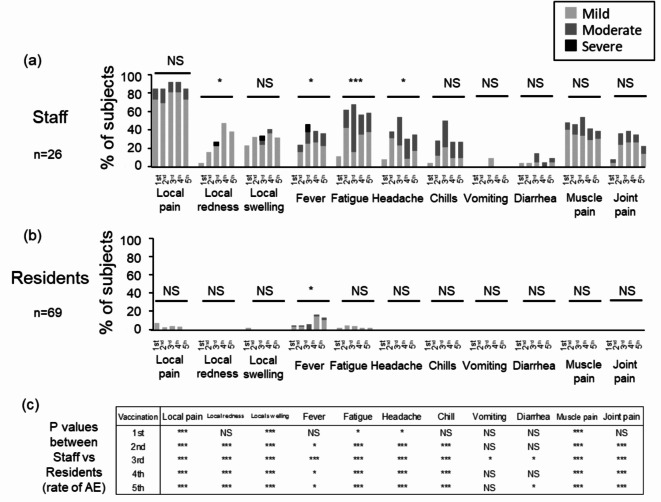
Fig. 3.
Comparisons of the rate of AEs between SARS-CoV-2 Naïve staff and residents after the COVID-19 vaccinations. The rate of AEs of SARS-CoV-2 naïve staff (n = 26) (a) and residents (n = 69) (b) by vaccine dose was compared using the Chi-square test. The light gray, the medium gray, or the black bars denote the case with mild, moderate, or severe AE. The p-value of the Chi-square test for comparing of the rate of AEs between staff and residents is shown in (c). ***, p < 0.001; *, p < 0.05. Abbreviations: AE, adverse event, NS, not significant.

