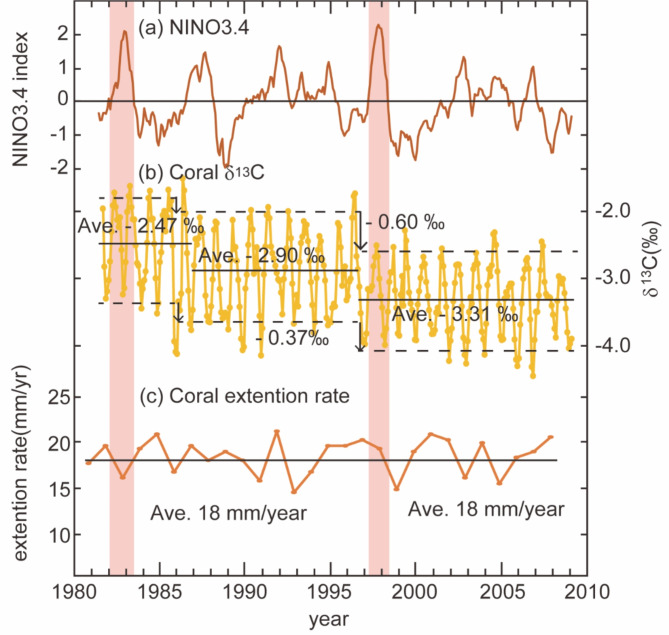
Fig. 4.
Comparison of NINO3.4 index (a) including 1997/1998 El Niño event with records of δ13C (b), and the coral extension rate (c). Black solid lines show averages in each period and broken lines show averages of maximum and minimum in each year. The solid black lines show the average of the respective periods before and after 1997/1998 El Niño, and the dashed lines show the average of the maximum and the minimum values for each year. The hatched areas represent the 1997/1998 El Niño seen from NINO3.4 index. The red hatched areas represent the particularly large 1981/1982 and 1997/1998 El Niño which NINO3.4 index indicates more than 2.

