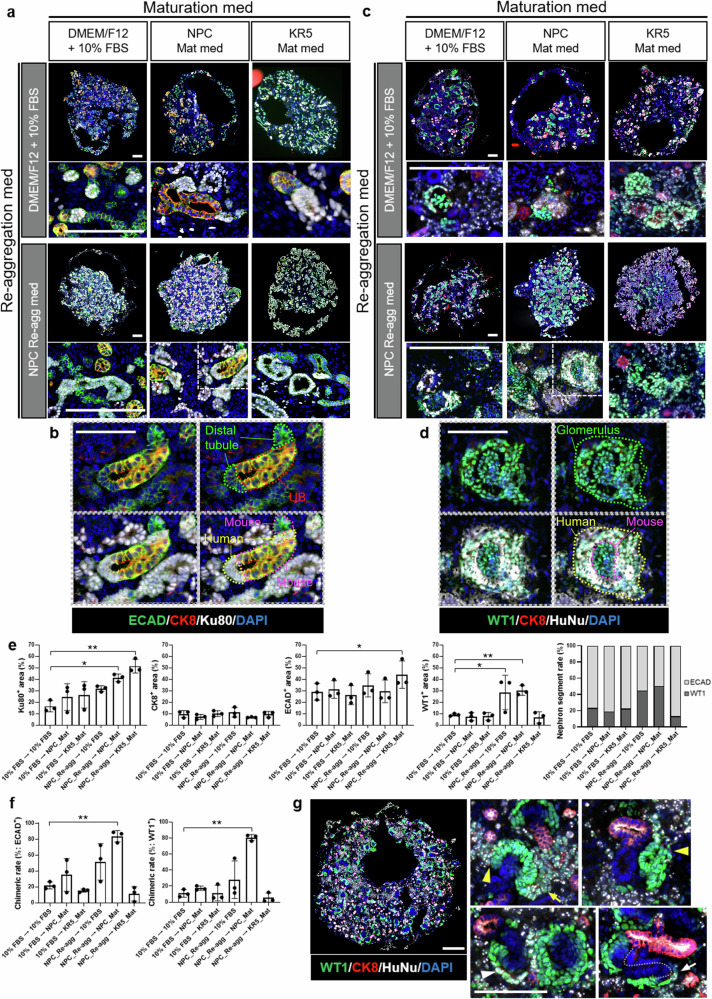
Fig. 2. Evaluation of human-mouse chimeric renal organoids formed under different culture conditions.
a, b Immunostaining images of chimeric renal organoids at Day 6 that were stained using antibody against a distal tubule marker, a ureteric bud marker, and a human cell marker. Scale bars represent 200 μm (a: original images) and 100 μm (b: magnified images). c, d Immunostaining images of chimeric renal organoids at Day 6 that were stained using antibody against a glomerulus marker, a ureteric bud marker, and a human cell marker. Scale bars represent 200 μm (c: original images) and 100 μm (d: magnified images). e Cellular composition analysis based on immunostaining images (n = 3 independent experiments; mean ± s.d.; *P < 0.05, **P < 0.01; one-way ANOVA followed by the Tukey test). f Quantitative analysis of chimera formation rate. The left graph indicates the chimera rate in distal tubule staining images, while the right graph indicates the chimera rate in glomerulus staining images (n = 3 independent experiments; mean ± s.d.; **P < 0.01; one-way ANOVA followed by the Tukey test). g Immunostaining images of chimeric renal organoids at Day 2 of culture in the combination of NPC_Re-agg and NPC_Mat media. White arrowhead indicates cap structure, yellow arrowheads indicate RVs, yellow arrow indicates comma-shaped body, and white arrow indicates S-shaped body. Scale bars represent 200 μm.

