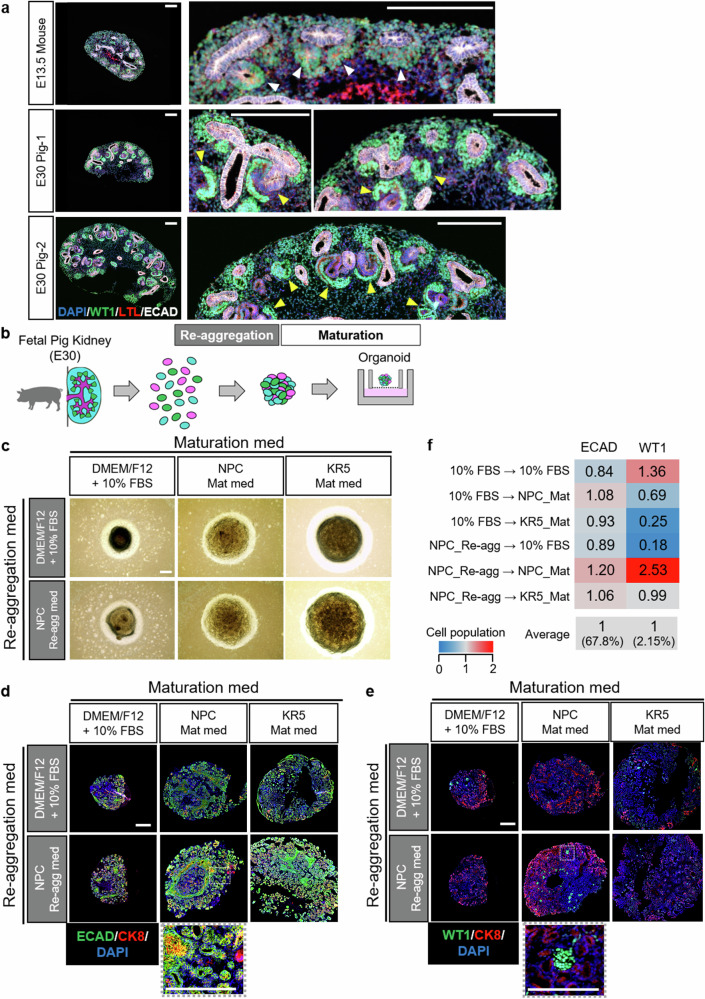
Fig. 3. Generation and evaluation of fetal pig kidney organoids.
a Histological comparative analysis of E13.5 mouse kidney and E30 pig kidney. Individual variation in fetal pig kidney size was observed, and representative examples of larger (E30 Pig-1) and smaller (E30 Pig-2) kidneys were presented. White arrowheads indicate RVs and yellow arrowheads indicate comma-shaped bodies or S-shaped bodies. Scale bars represent 200 μm. b Experimental scheme of organoid formation using fetal pig kidneys. c Bright-field images of pig kidney organoids formed under different culture conditions. Scale bar represents 200 μm. d Immunostaining images of pig kidney organoids at Day 6 that were stained by antibody against a distal tubule marker and a ureteric bud marker. Scale bar represents 200 μm. e Immunostaining images of pig kidney organoids at Day 6 that were stained by antibody against a glomerular marker and a ureteric bud marker. Scale bar represents 200 μm. f Quantitative analysis of cell composition ratio for fetal pig kidney organoids under various culture conditions.

