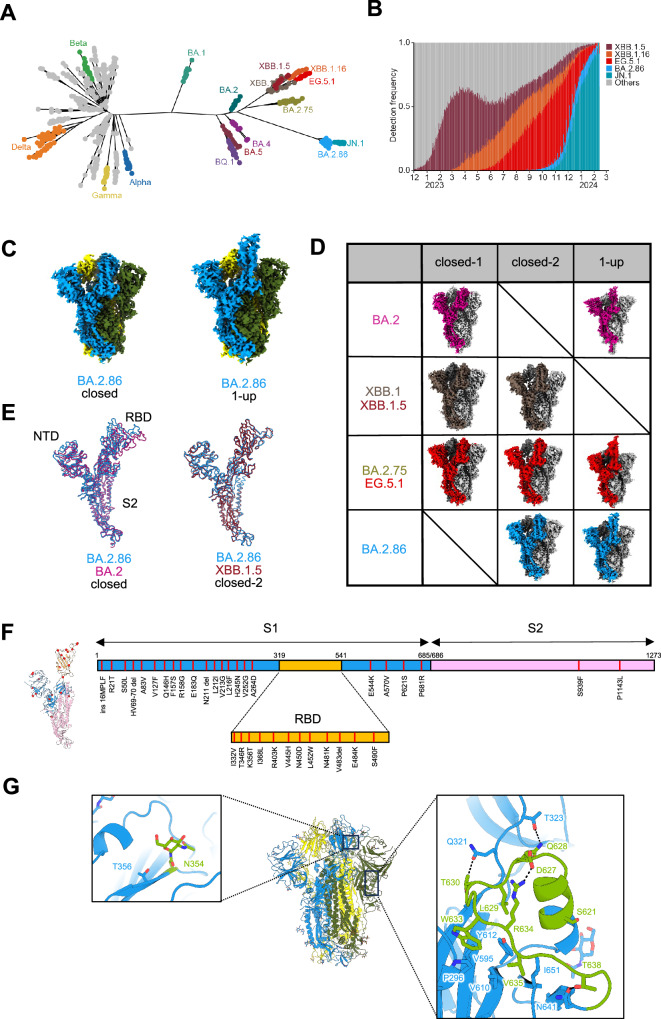
Fig. 1. Evolutionary and epidemic features of BA.2.86 and cryo-EM maps of BA.2.86-S-protein.
A Maximum likelihood tree depicting SARS-CoV-2 evolution. B Detection frequency plot of XB.1.5, XBB.1.6, EG.5.1, BA.2.86, JN.1, and other variants. C Cryo-EM maps of the BA.2.86-S-protein trimer, closed-2 state (left) and one-RBD-up state (right); protomers are sky blue, yellow, and dark olive green. D Cryo-EM maps obtained for each Omicron subvariants. Protomers for BA.2, XBB.1/XBB.1.5, BA.2.75/EG.5.1, and BA.2.86 are shown in dark green, brown, red, and sky blue, respectively. Other protomers are shown in dark gray and light gray. E Superposition of the main-chain structure as protomers of the BA.2.86-S closed-2 state (sky blue), BA.2-S closed-1 state (deep pink), and XBB.1.5-S closed-2 state (raspberry), respectively. F The position of amino-acid substitutions in the BA.2.86-S-protein compared to the XBB.1.5-S-protein. The BA.2.86-S protomer structure (left) and its sequence schematic (right) are shown as the S1 subunit (sky blue), the S2 subunit (pink), and the RBD (bright yellow). G Structure of BA.2.86-S-protein trimer (same colors as in C); close-up view presents the N354-linked glycan (left) and residues 621–640 (right), showing interactions with surrounding residues and glycosylation sites as sticks (leaf green). Dashed lines represent hydrogen bonds.

