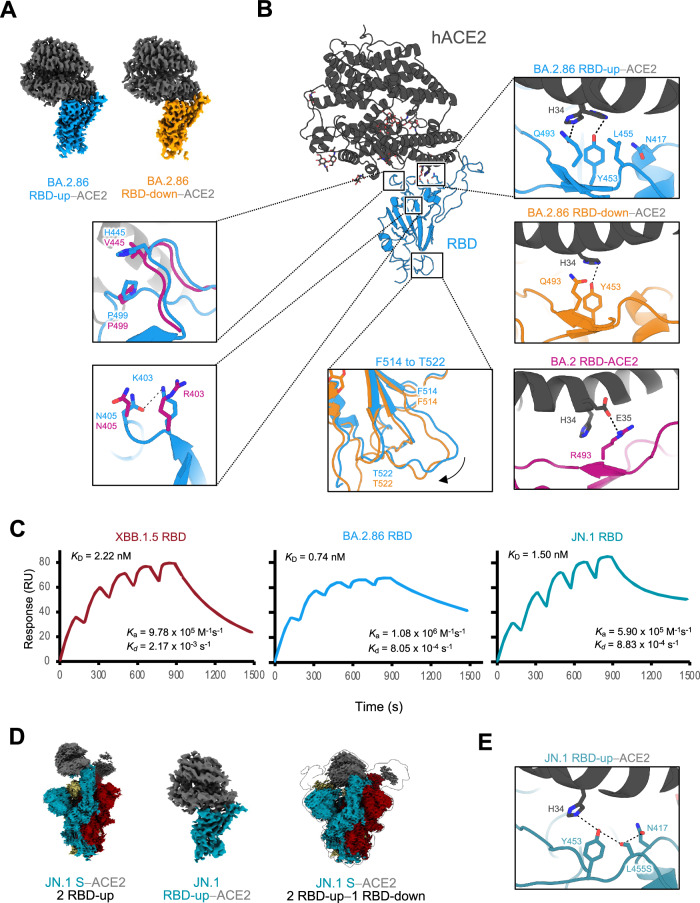
Fig. 3. Structures of RBD-ACE2 complexes in the BA.2.86- and JN.1-S- proteins, and binding affinities to ACE2 in the XBB.1.5, BA.2.86, and JN.1.
A Cryo-EM maps of the RBD–ACE2 interface in the RBD-up (sky blue)−ACE2 (dark gray), and RBD-down (orange)−ACE2. B Structure of BA.2.86 S RBD-ACE2 complex (same colors as in A). Close-up views represent residues involved in the corresponding interaction of the BA.2.86 RBD-up–ACE2 complex structure, which differs from the BA.2 or BA.2.86 RBD-down–ACE2 complex structure (BA.2; PDB, 8DM6; BA.2 RBD, deep pink; ACE2, dark gray, BA.2.86 RBD-down; same color as A), are shown. Dashed lines represent hydrogen bonds. C Sensorgrams of SPR analysis evaluating the binding affinities of ACE2 for BA.2.86 S-RBD (sky blue), JN.1 S-RBD (blue-green), and XBB.1.5 S- RBD (raspberry). D Cryo-EM maps of JN.1-S-protein bound to human ACE2 (S; blue-green, raspberry and khaki, ACE2; dark gray). The two-RBD-uptwo-ACE2 state (left), the RBD-ACE2 interface in the RBD-up−ACE2 (middle), and the two-RBD-up−one-RBD-downthree-ACE2 state (right). E Close-up view of the JN.1 S–ACE2 interface (JN.1 S; blue-green, ACE2; dark gray). Dashed lines represent hydrogen bonds.

