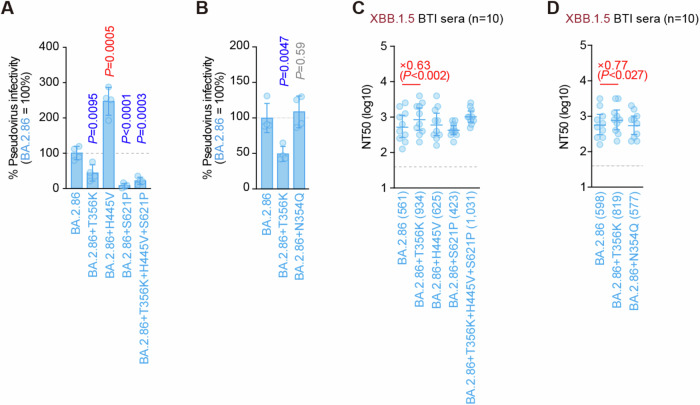
Fig. 4. Effects of amino acid substitution on BA.2.86 infectivity and immune evasion.
A, B Lentivirus-based pseudovirus assay. HOS-ACE2/TMPRSS2 cells were infected with pseudoviruses bearing each S-protein of BA.2.86 and its derivatives. The amount of input virus was normalized to that of HIV-1 p24 capsid protein. The percent infectivity of BA.2.86 derivatives compared to that of BA.2.86 is shown. The horizontal dashed line indicates the mean value of the percentage infectivity of BA.2.86. Assays were performed in quadruplicate, and a representative result of four independent assays is shown. Data are presented as the mean ± SD. Each dot indicates the result of an individual replicate. Statistically significant differences versus BA.2.86 are determined by two-sided Student’s t tests. The p values for the difference of each infectivity are indicated in A (vs BA.2.86 + T356K, p = 0.0095; vs BA.2.86 + H445V, p = 0.0005; vs BA.2.86 + S621P, p < 0.0001; and vs BA.2.86 + T356K + H445V + S621P, p = 0.0003) and in (B) (vs BA.2.86 + T356K, p = 0.0047 and vs BA.2.86 + N354Q, p = 0.59). Increased and decreased infectivity are shown in red and blue, respectively. C, D Neutralization assay. Assays were performed with pseudoviruses harboring the S-proteins of BA.2.86 and its derivatives. Convalescent sera were used, which were from fully vaccinated individuals who had been infected with XBB.1.5 (four 3-dose vaccinated, three 4-dose vaccinated, two 5-dose vaccinated, and one 6-dose vaccinated; total =10 donors). Assays for each serum sample were performed in quadruplicate to determine the 50% neutralization titer (NT50). Each dot represents one NT50 value, and the geometric mean and 95% confidence interval are shown. Numbers in parentheses indicates the geometric mean of NT50 values. The horizontal dashed line indicates the detection limit (40-fold). Statistically significant differences vs. BA.2.86 were determined by two-sided Wilcoxon signed-rank tests. The p-values less than 0.05 for the difference of each NT50 are indicated in C (vs BA.2.86 + T356K, p = 0.0020; vs BA.2.86 + H445V, p = 0.22; vs BA.2.86 + S621P, p = 0.32; and vs BA.2.86 + T356K + H445V + S621P, p = 0.10) and in D (vs BA.2.86 + T356K, p = 0.027 and vs BA.2.86 + N354Q, p = 0.77). NT50 fold changes compared with BA.2.86 are indicated by X.

