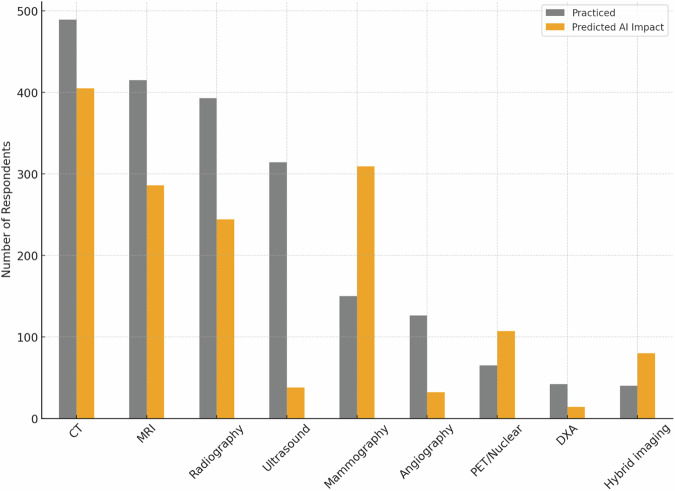
Fig. 3.
Distribution of responders according to imaging modalities, practised and predicted to be impacted by AI. Gray bars represent the number of responders practising each modality (sorted in decreasing order), while the orange bars represent those who believe that that modality will be impacted by AI applications. CT, computed tomography; MRI, magnetic resonance imaging; PET, positron emission tomography; DXA, dual-energy X-ray absorptiometry

