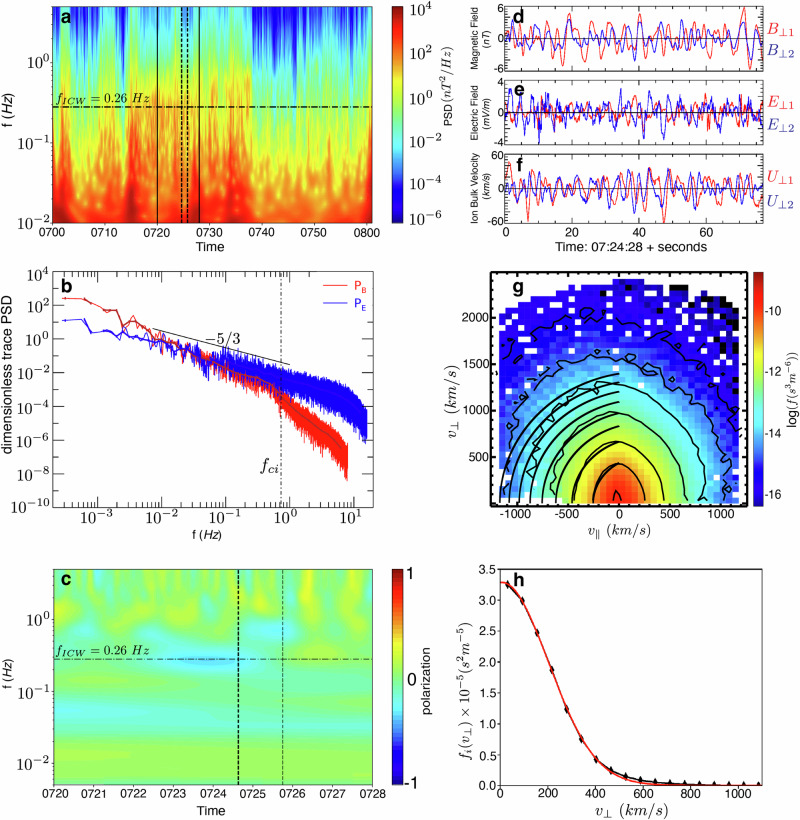
Fig. 2. Evidence of ion cyclotron waves and ion distribution response.
a Magnetic field energy spectrum from MMS1 over 07:00–08:00 on 12 January 2016. Solid vertical lines indicate the 8 minute interval shown in c, dashed vertical lines indicate the 77 s burst-mode interval analyzed in this work, horizontal dashed-dotted line indicates the ion cyclotron wave frequency. b Dimensionless trace PSD of magnetic field (PB, red) and electric field (PE, blue) with spectral index of −5/3 (black) shown, vertical dashed-dotted line indicates the ion cyclotron frequency. c Magnetic field polarization from 07:20–07:28, where dashed vertical lines indicate the 77 s burst-mode interval; significant left-hand polarization is observed at frequency fICW ≃ 0.26 Hz (horizontal dashed-dotted line). Perpendicular components of (d) the magnetic field, (e) electric field, and (f) ion bulk velocity, all high-pass filtered at fcut = 0.1 Hz. g Background ion distribution f0i(v⊥, v∥) for the 77 s interval, with contours of constant energy (solid black) in the wave frame centered at vph = 0.7vA. h Reduced perpendicular ion distribution f0i(v⊥) (black) with an overplotted Gaussian fit (red). Source data are provided as a Source Data file.

