
Fig. 7. The particle energization rate versus the theoretical cascade rate ϵ.
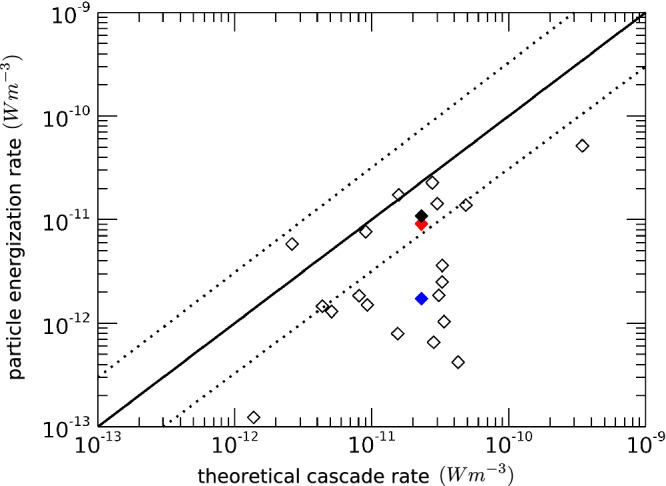
The solid line represents particle energization rates equal to the estimated turbulent cascade rate ϵ, with the dotted lines indicating the range of the order-of-magnitude estimate of ϵ. We plot the parallel electron energization rates from twenty intervals in Afshari et al. (open diamonds), highlighting from the interval analyzed here (their Interval 02, blue diamond)37. The perpendicular ion energization (red diamond) by ion cyclotron damping is plotted along with the sum of ion and electron energization rates (black diamond). Source data are provided as a Source Data file.