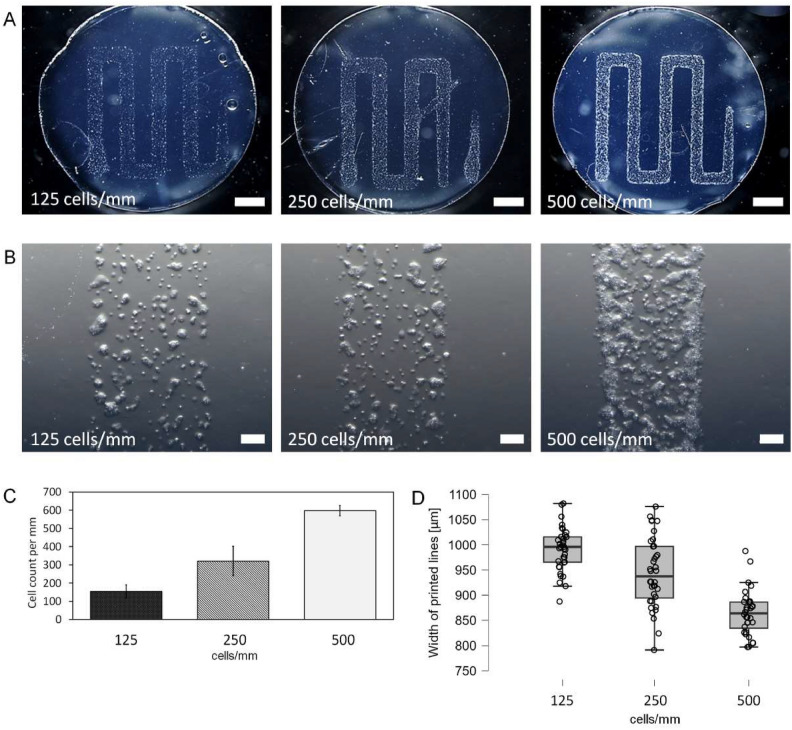
Fig. 4.
Rectilinear patterns printed with LESC cells on fibrin for tree different cell concentrations. Microphotograph of a fibrin sample with the pattern of cell suspension printed for three different concentrations (A). Microscopic image of the distribution of cells on a printed line section (B). Cell count in each bioprint per mm of printed path (C). Width of printed cell lines for each cell concentration (D). Cell count in each print is close to targeted values of 500, 250 and 125 cells/mm. Cell distribution in line is not homogenic – cells are mostly located in groups on the edges of the lines. Scalebar = 2 mm (A), scalebar = 0.2 mm (B).

