
Fig. 1.
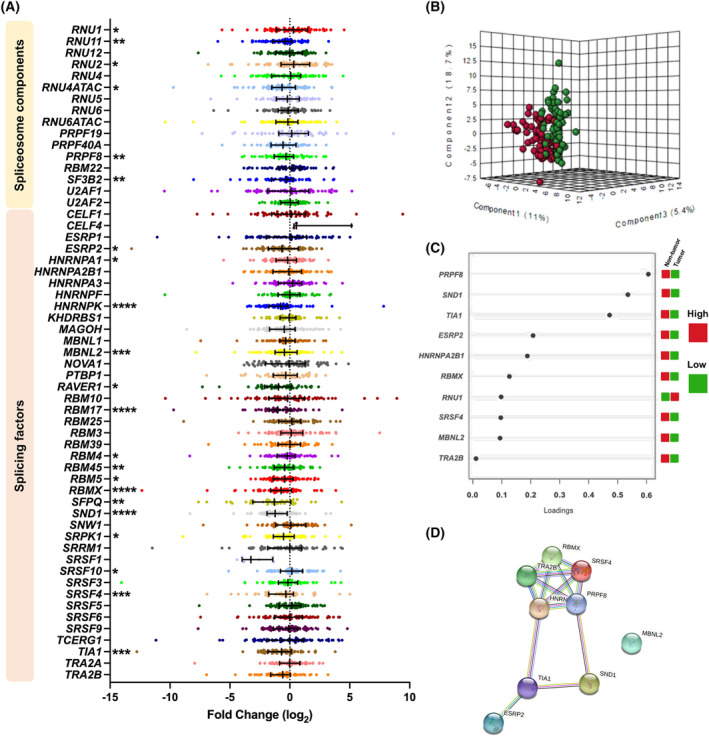
Splicing dysregulation in Pancreatic Ductal Adenocarcinoma. (A) Fold Change of mRNA levels expressions of Spliceosome Components and Splicing Factors of PDAC FFPE samples compared with non‐tumor adjacent tissue. Data are represented by Fold Change mRNA levels normalized by ACTB expression levels ± SEM. Asterisks indicate significantly differences between groups by Mann–Whitney U test (*P < 0.05; **P < 0.01; ***P < 0.001; ****P < 0.0001). (B) Principal Components Analysis (PCA) of the splicing machinery components analyzed in PDAC FFPE samples cohort. (C) sPLSDA analysis showing the best classifying factors between tumor and non‐tumor adjacent tissue in our cohort. Higher expression is shown in red and lower expression in green. (D) STRING analysis of relationships among altered components based on the top genes showing the most differences between the expression in tumor and non‐tumor adjacent tissues.