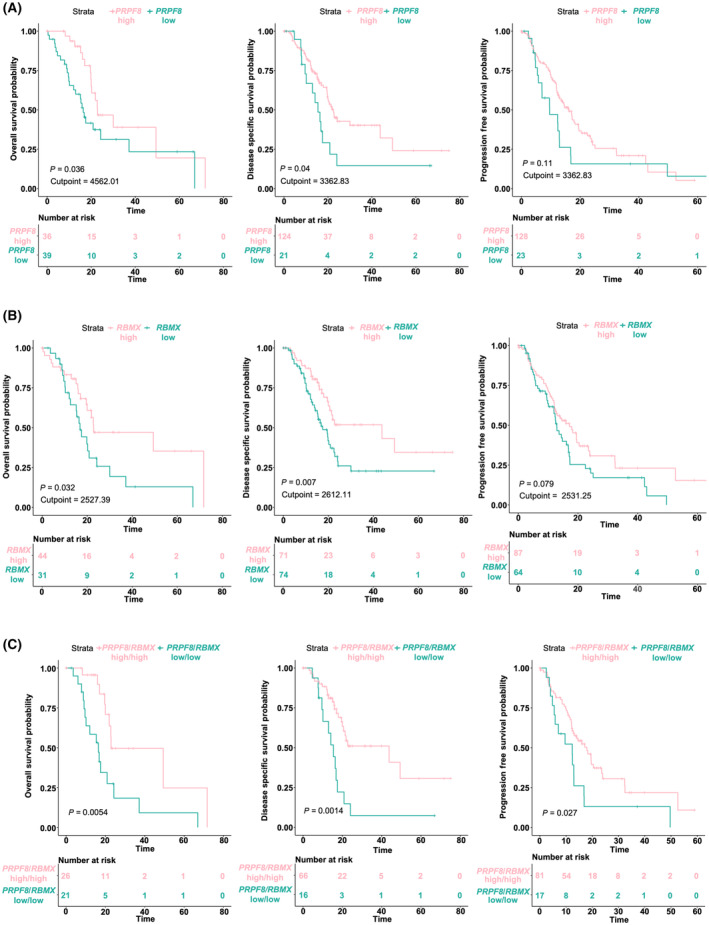
Fig. 3.

Survival analysis expression levels in PDAC. (A–C) Kaplan–Meier Survival analysis, Overall Survival and Relapse Free Survival associated with PRPF8 (A) and RBMX (B), mRNA expression levels and their combination (C), respectively, in PanCancer cohort [2]. The respective curves at high (pink) and low (blue) levels of each factor are shown, as well as the P‐value calculated by log‐rank test, the cut‐off point to separate the expression groups and the number at risk in each group.
