Fig. 8.

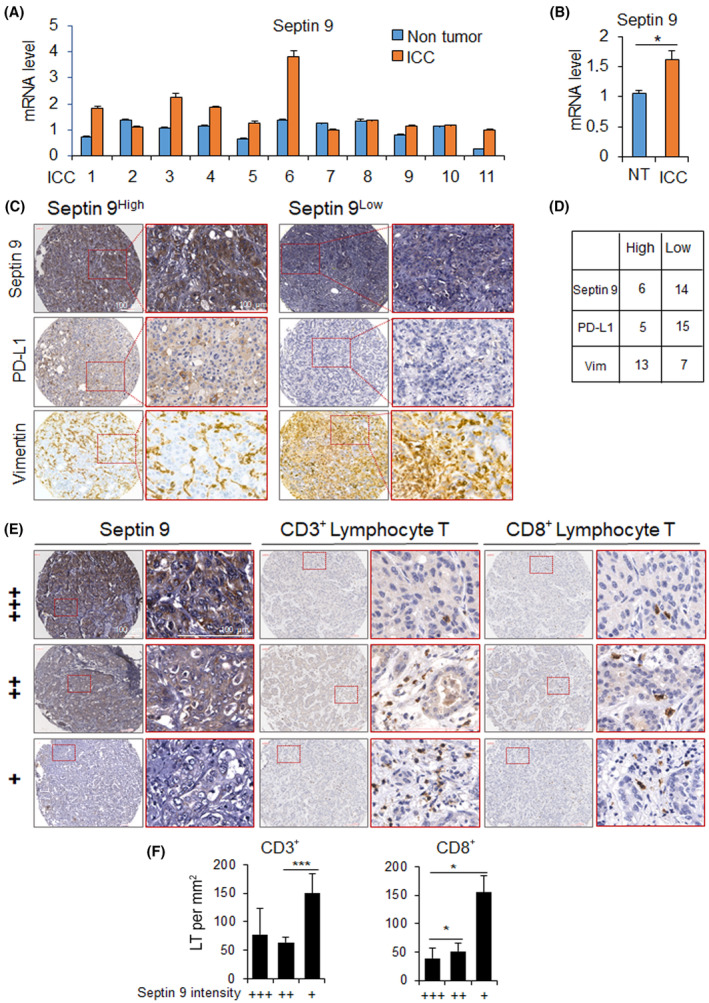
Septin 9 and PD‐L1 expression in iCCA tissues. (A) Analysis of the mRNA levels of septin 9 by RT‐qPCR for 11 samples of iCCA with corresponding NT (non‐tumor) area. (B) The mean of analysis in (A) Values presented as mean ± SEM (*P < 0.05, Student's t‐test). (C) Immunohistochemistry staining of septin 9, PD‐L1 and vimentin in 20 samples iCCA on a TMA (Tissue Microarray). Negative, weak (+), moderate (++), and strong‐level expression (+++) were the classifications assigned to specimens with total scores (as described in Section 2). Among these, group Low comprises negative and weak expression, whereas group High comprises moderate and high expression. Typical staining outcomes of high/low septin 9 are presented, juxtaposed with the PD‐L1 and vimentin staining using the identical sample. Scale bar, 100 μm. (D) Count of samples exhibiting low/high levels of Septin 9, PD‐L1 and vimentin staining. (E) Immunohistochemistry staining of CD3 and CD8 in 20 samples iCCA on the same TMA for septin 9. The typical staining results of septin 9, showcasing three distinct intensity levels as mentioned in (C), are presented alongside CD3/CD8 staining using the same sample. Scale bar, 100 μm. (F) Expression correlation studies of infiltrating CD3+/CD8+ T lymphocyte with septin 9. Groups: weak (+) n = 14; moderate (++) n = 3; strong (+++) n = 3. Lymphocyte counts were quantified in three randomly selected areas of 0.11 square millimeters each per sample. Values presented as mean ± SEM (*P < 0.05, ***P < 0.001, Student's t‐test). (iCCA, Intrahepatic cholangiocarcinoma; LT, lymphocyte T cells; NT, non‐tumor; PD‐L1, programmed cell death ligand 1; RT‐qPCR, Reverse Transcription and Real‐time PCR analysis; TMA, tissue microarray).
