
Fig. 3.
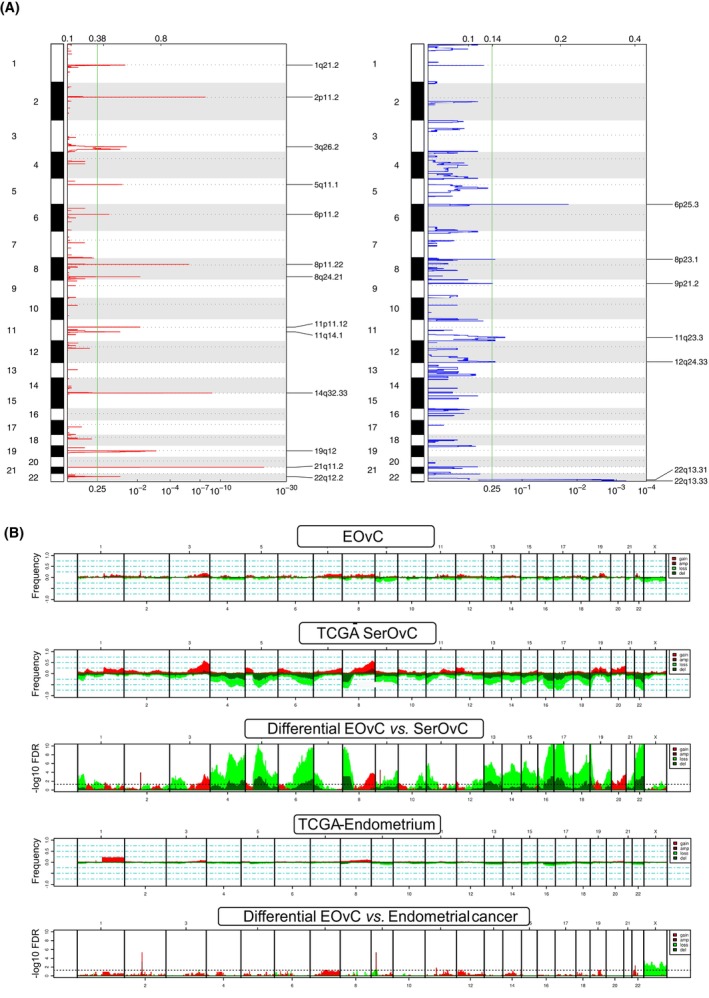
Copy number alterations in endometrioid ovarian cancer (N = 33). (A) Frequency plot of recurrent copy number alterations identified in endometrioid ovarian cancer (EOvC) tumors using the GISTIC algorithm. Frequencies of gains (red) and losses (blue) are plotted as a result of chromosome location. X‐axis: top = log–scale ratio; bottom = q‐values. Green lines represent the threshold for significance. (B) Supervised analysis comparing EOvC samples to high‐grade serous ovarian carcinoma and endometrial tumors from TCGA datasets. Dotted line of the bottom charts comparing EOvC to high‐grade serous ovarian cancer or endometrioid endometrial cancer: threshold of significance associated with a False Discovery Rate < 0.25.