Fig. 3.

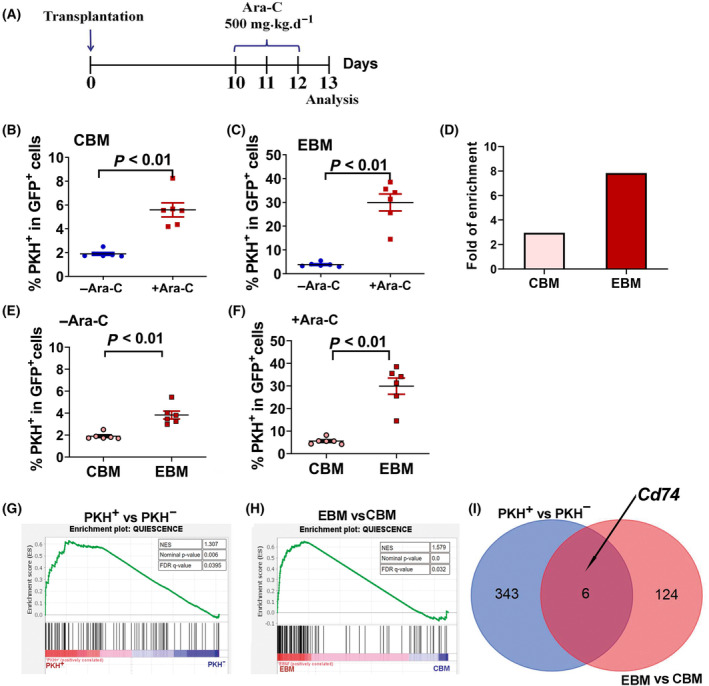
Enrichment of PKH+ leukemia cell population by chemotherapy in vivo. (A) Ara‐C treatment regimen in vivo. The mice received 500 mg/kg Ara‐C for 3 days beginning on day 10 after PKH26‐stained leukemia cells transplantation. PKH+ cell population were evaluated 1 day after the last Ara‐C treatment. (B) The ratio of PKH+/ GFP+ cells from flushed bone marrow (CBM) of PKH26‐stained leukemia cells transplanted mice treated with or without Ara‐C. (C) The ratio of PKH+/ GFP+ cells from collagenase digested fragments (EBM) of PKH26‐stained leukemia cells transplanted mice treated with or without Ara‐C. (D) The fold of enrichment by Ara‐C treatment in CBM and EBM. Data are obtained by dividing the average value of PKH+/GFP+% from six Ara‐C‐treated mice by that value from six Ara‐C‐untreated mice. (E) Percentage of PKH+ cells in GFP+ cells of CBM and EBM from untreated mice. (F) Percentage of PKH+ cells in GFP+ cells of CBM and EBM from Ara‐C‐treated mice. The data are presented as the mean ± SEM from six mice and the statistical significances were determined using unpaired t‐test (B, C, E, F). (G) Enrichment plot from the gene set enrichment analysis (GSEA) for quiescence‐related genes in PKH+ cell population. (H) Enrichment plot from GSEA for quiescence‐related genes in EBM leukemia cells group. (I) Venn analysis of significantly upregulated genes in PKH+ vs. PKH− group and EBM vs. CBM group. CBM, central bone marrow; EBM, endosteal surface of bone marrow.
