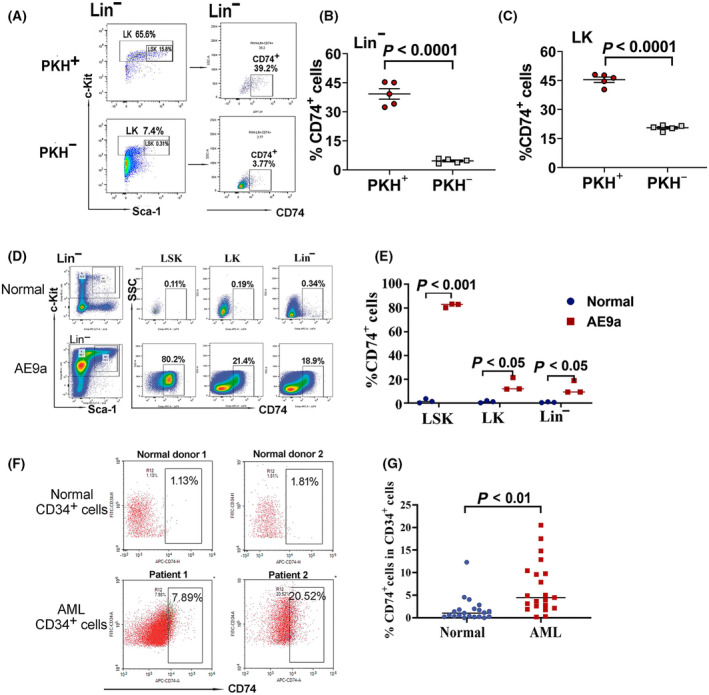
Fig. 4.

Cell surface CD74 expression in bone marrow of AE9a leukemia mouse and human AML leukemia stem cells. (A–C) Cell surface CD74 expression in PKH+ and PKH− cell populations in bone marrow of PKH26‐stained leukemia cells transplanted mice. The ratio of CD74+ cells in PKH+ and PKH− cell population was analyzed on day 10 after the mice being transplanted with PKH26‐stained leukemia cells. (A) Representative flow cytometry plots for cell surface CD74 expressions in Lin− leukemia cells in PKH+ and PKH− cell populations. (B) The percentage of CD74+ cells in PKH+ and PKH− cell populations in Lin− leukemia cells. (C) The percentage of CD74+ cells in PKH+ and PKH− cell populations in Lin−c‐Kit+ (LK) leukemia cells. The data are presented as the mean ± SEM from five mice (B, C). (D) Representative flow cytometry plots for cell surface CD74 expressions in LSK (Lin−c‐Kit+Sca‐1+), LK (Lin−c‐Kit+) and Lin− cell populations in normal and AE9a leukemia mice. (E) The percentage of CD74+ cells in LSK (Lin−c‐Kit+Sca‐1+), LK (Lin−c‐Kit+) and Lin− cell populations in normal and AE9a leukemia mice. Data are presented as the mean ± SEM from three mice in each group. (F) Representative flow cytometry plot showing the expression of CD74 in CD34+ leukemia cells in normal bone marrow (from two normal donors) and AML patients (from two AML patients). (G) The ratio of CD74+/CD34+ cells in bone marrow of normal donors (n = 21) and AML patients (n = 21). The statistical significances were determined using unpaired t‐test (B, C, E, G).
