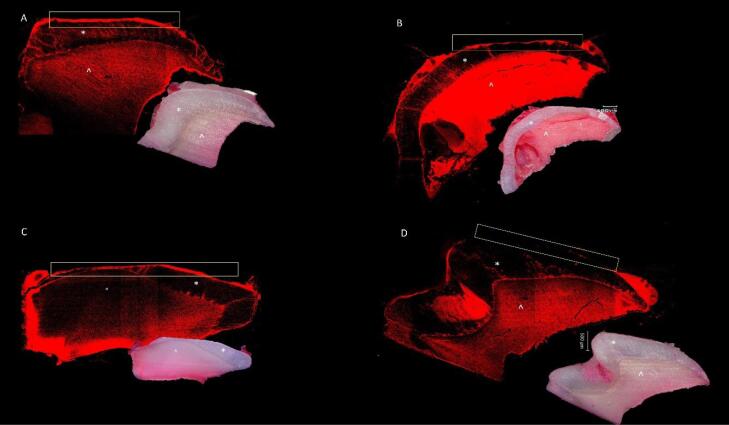
Figure 2.
Stereomicroscope and confocal laser microscope images of representative samples. (A) Negative control; the deepest penetration values were measured in the control group. (B) NaF. (C) CPP-ACP; different penetration values were measured. (D) GSE + NaF; the representative sample has almost no penetration. The yellow rectangle indicates the area of penetration in enamel. * denotes the enamel, and ^ denotes the dentin of the samples [scale bar of stereomicroscopic images is 400 µm (B) and scale bar of CLSM images is 500 µm (D)]

