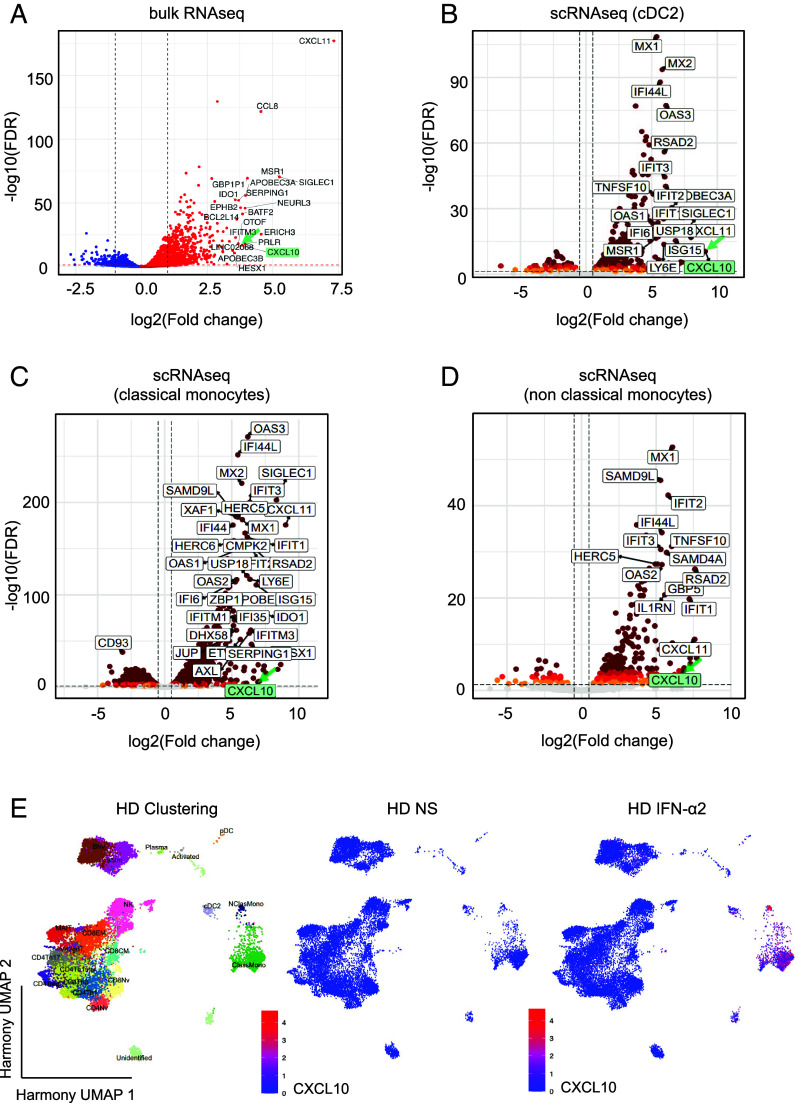
Fig. 2.
Whole-transcriptome analysis after PBMC stimulation with IFN-α2. (A) Volcano plot analysis of bulk RNAseq performed on total mRNA extracted from the PBMCs of three healthy donors after stimulation with 1 ng/mL glycosylated IFN-α2 for 6 h. The labeled genes are the top 20 genes displaying the highest levels of induction relative to nonstimulated conditions. (B–D) Volcano plot analysis showing the transcripts induced in cDC2 cells (B), classical monocytes (C), and nonclassical monocytes (D), as determined by scRNAseq (Parse Bioscience). PBMCs of three healthy donors were stimulated with 1 ng/mL glycosylated IFN-α2 for 6 h and whole mRNA was extracted. (E) Single-cell transcriptom analysis. PBMCs from three HD were analyzed after IFN-α2 stimulation vs unstimulated. Clustering analysis. After batch correction with Harmony, celltypes were identified manually. Feature plots show the induction of CXCL10 (encoding IP-10).

