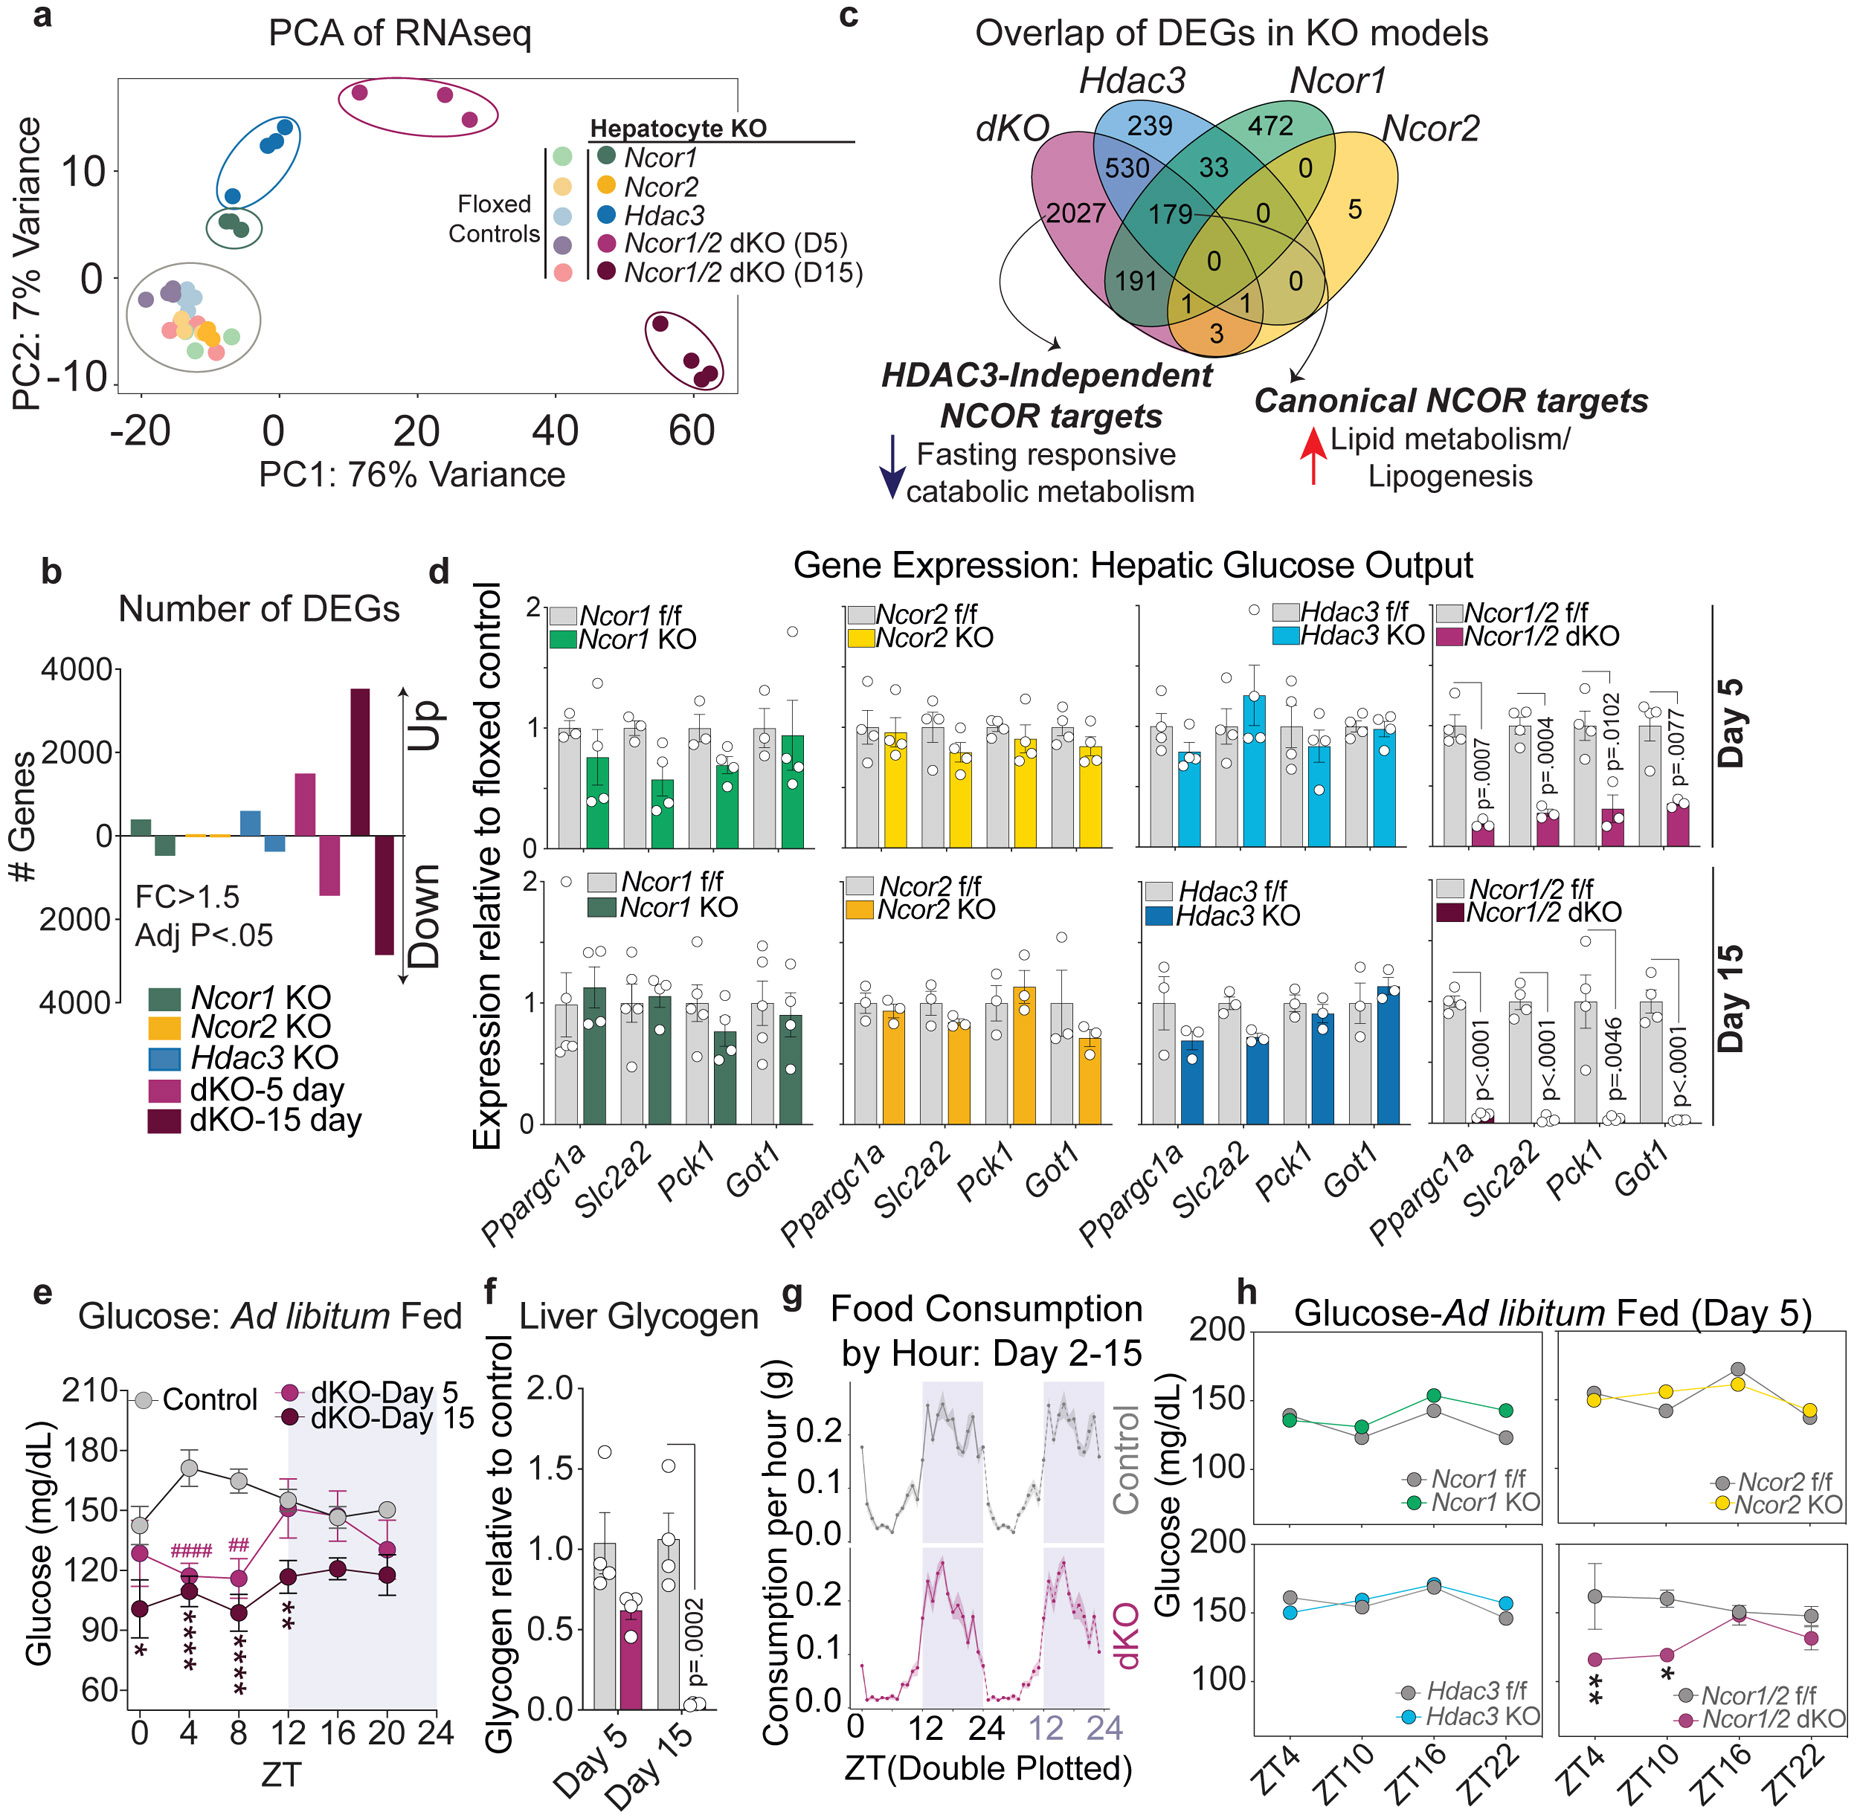
Figure 1. Loss of NCOR1 and 2 in hepatocytes results in severe hypoglycemia.

a, Principal Component Analysis (PCA) of RNAseq data from dKO (5 and 15 days post knockout) and single knockout (15 days post knockout) livers. b, Number of differentially expressed genes in each model (DEGs determined by fold change >1.5 compared to each respective floxed control and FDR< .05). Upregulated genes are indicated above the x-axis and downregulated genes are below the x-axis. c, Venn Diagram of differentially expressed genes in each knockout model (dKO: Day 5, Hdac3, Ncor1, Ncor2: Day 15). d, RT-qPCR of genes related to hepatic glucose output, relative to 36b4. Data are presented as mean values +/− S.E.M. and p-values were calculated using two-tailed unpaired student’s t-test with correction for multiple comparisons using the Holm-Šídák method. Biological replicates representing individual mice are plotted (n=3-4 mice per timepoint and genotype). e, Blood glucose levels measured every 4 hours in ad-libitum fed mice, 5 and 15 days post AAV injection. Data are presented as mean values +/− S.E.M.: Day 5 dKO, (n=5 mice), Day 15 dKO, (n=6 mice), Control Day 5 (n=5 mice), Control Day 15 (n=5 mice). Control mouse data measured at day 5 and 15 were pooled for visualization. P-values were calculated for each time point by RM two-way ANOVA with Šídák’s multiple comparisons test; (#) refer to p-values at day 5, while (*) refer to p-values at day 15. Day 5: ZT4 (p=<.0001), ZT8 (p=.0013). Day 15: ZT0 (p=.0109), ZT4 (p<.0001), ZT8 (p<.0001), ZT12 (p=.0017). f, Relative glycogen levels at ZT10 (5 PM) in dKO livers compared to controls at day 5 and day 15 post AAV injection (n=4 mice per group). Data are presented as mean values +/− S.E.M.and p-values were calculated for each time point by two-way ANOVA. g, Double-plotted mean food consumption (measured via BioDAQ) per hour for singly-housed control and dKO for days 2-15 post AAV injection (n=5 mice, shaded ribbon represents standard deviation). h, Blood glucose in ad-libitum fed mice at 4 timepoints, 5 days post AAV). The mean +/− S.E.M of the biological replicates is plotted: Ncor1 f/f (n=5 mice), Ncor1 KO (n=5 mice), Ncor2 f/f (n=3 mice), Ncor2 KO (n=3 mice), Hdac3 f/f (n=4 mice), Hdac3 KO (n=4 mice), Ncor1/2 f/f (n=3 mice), dKO (n-4 mice). p-values were calculated by RM two-way ANOVA with Šídák’s multiple comparisons test: dKO ZT4 (p=.0088), dKO ZT10 (p=.0206).
