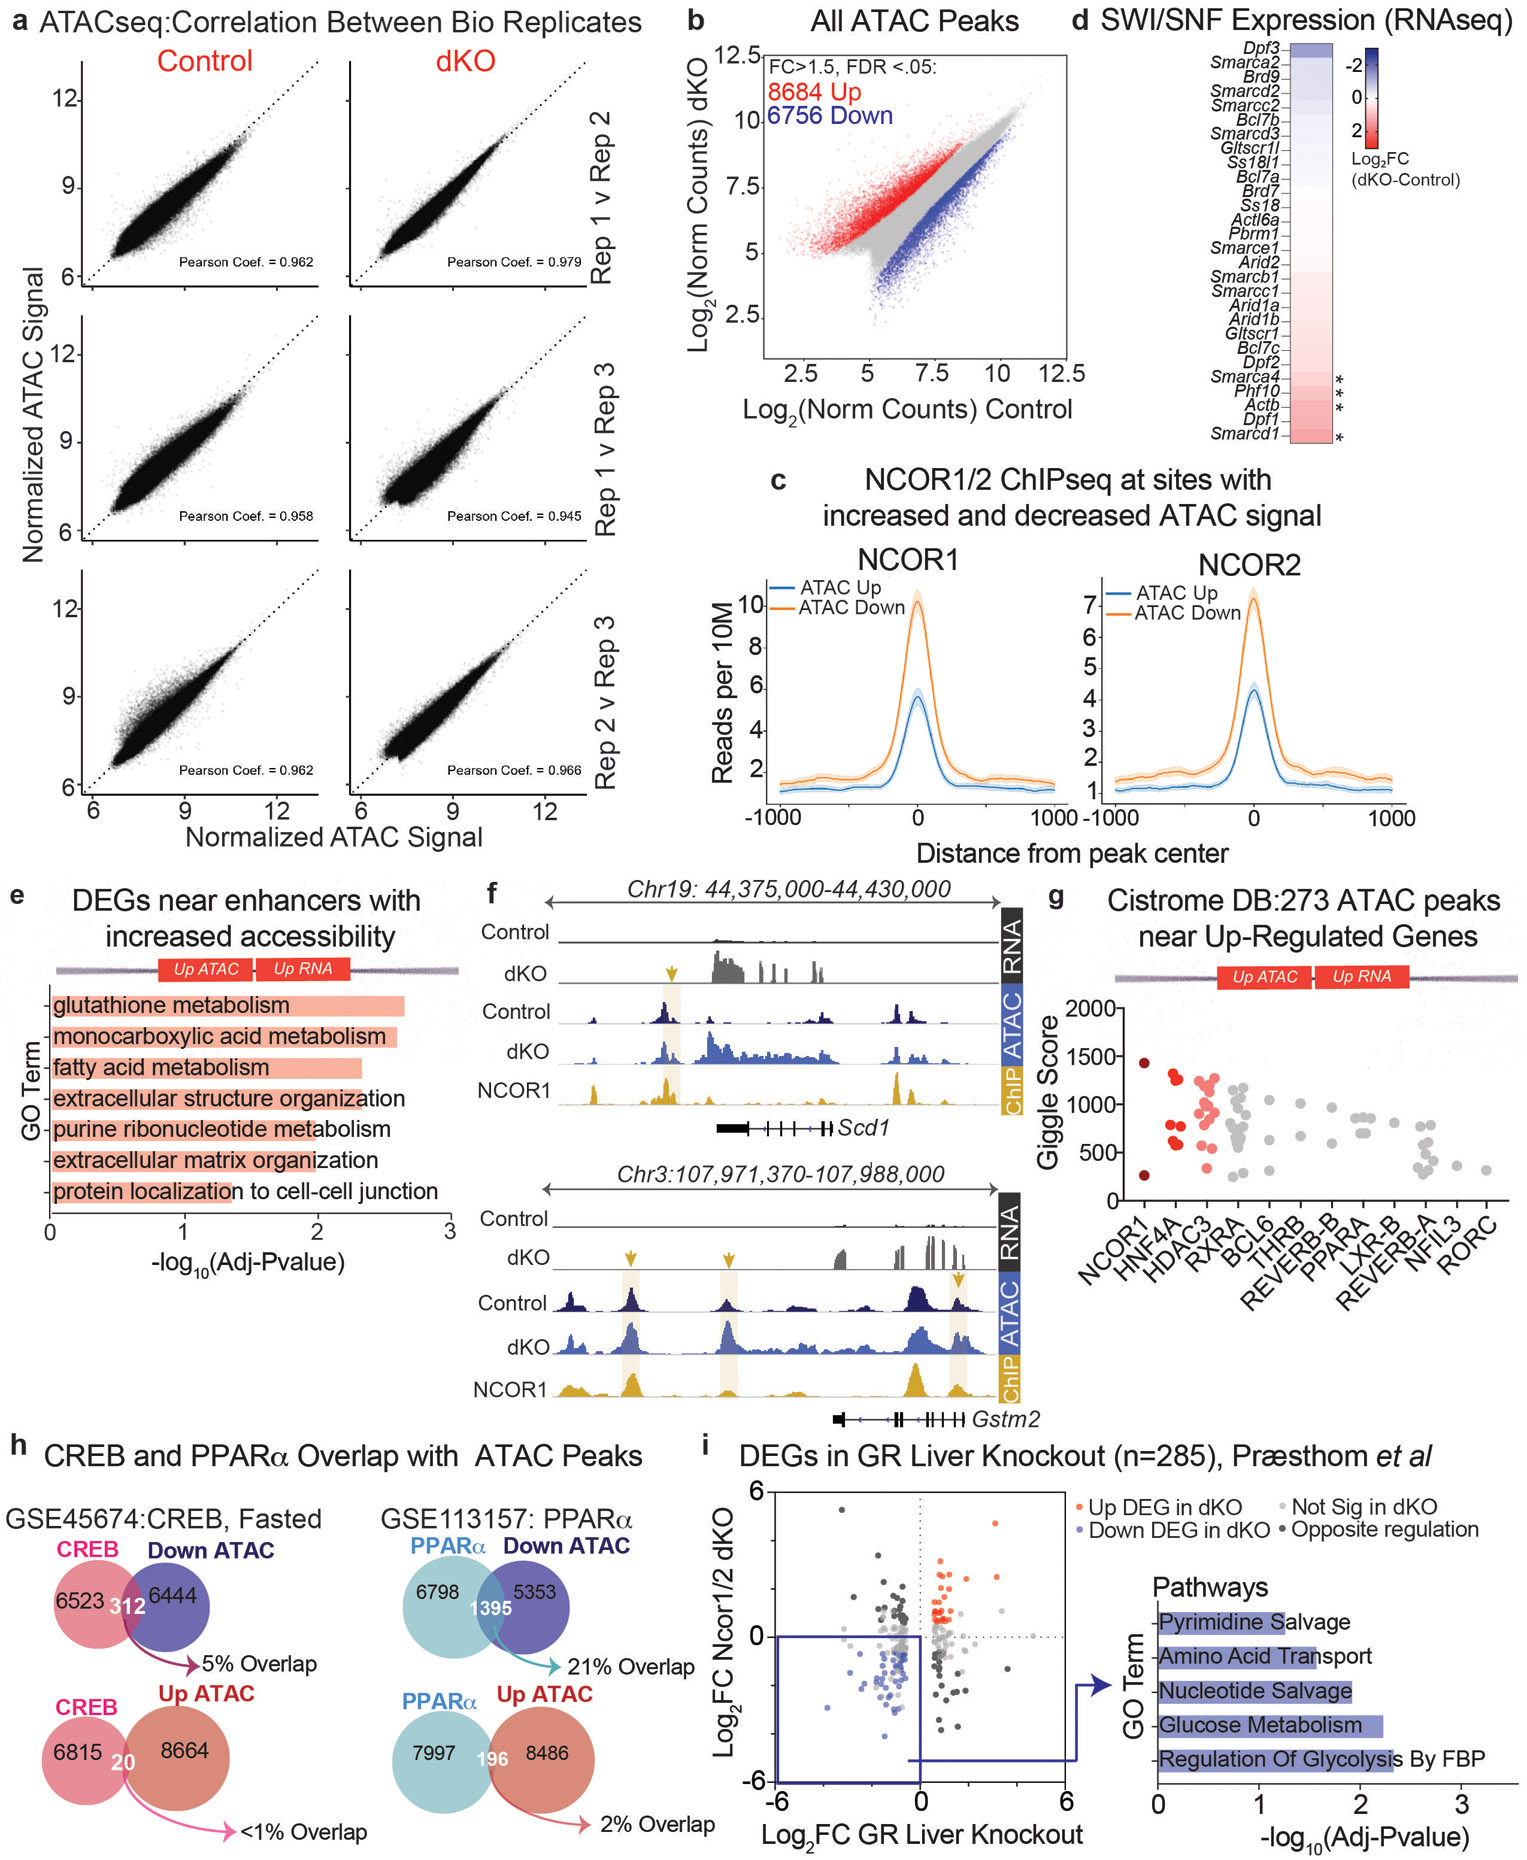
Extended Data Figure 7. Loss of hepatic NCORs results in decreased chromatin accessibility at enhancers of glucoregulatory genes.

a, Correlation scatter plots of ATACseq biological replicates. b, Scatter plot of ATACseq normalized counts from hepatocytes isolated from control and dKO livers, 5 days post AAV injection. Sites of increased accessibility relative to control livers are shown in red and decreased accessibility shown in blue. Differential sites (indicated by *) exhibit a fold change>1.5 in dKO compared to control, with FDR <.05 (n=3). c, Average profiles of NCOR1 (GSM647027) and NCOR2 (GSM1236494) ChIPseq from control livers (ZT10) at sites exhibiting increased accessibility in dKO hepatocytes (blue track) vs. sites exhibiting decreased accessibility (orange track). Shading indicates 95% confidence interval. d, Heatmap showing Log2 Fold Change in gene expression (RNAseq, Day 5 dKO vs Ncor1/2 floxed contols) of SWI/SNF factors. * indicates FDR<.05 and fold change >1.5. e, FDR of Top significant terms (GO: Biological Process) of upregulated genes nearest to the 273 enhancers bound by NCOR1/2 with increased accessibility. f, Example tracks of loci with enhancers exhibiting increased accessibility and increased gene expression. RNAseq tracks (control and dKO day 5 livers, group autoscaled), ATACseq tracks (hepatocytes isolated from control and dKO day 5 livers, group autoscaled) and NCOR1 ChIPseq (control livers, ZT10, autoscaled) are shown. g, Top 12 factors, ranked by Giggle Score, with overlapping cistromes compared to 273 NCOR1/2-bound ATAC peaks near upregulated genes. h, Venn diagrams showing overlap of peaks between Liver CREB ChIPseq (GSE45674, Fasted) and PPARα (GSE113157) with differential ATAC peaks. i, Scatter plot of differentially expressed genes in GR-liver specific knockouts (Præsthom et al: GSE173723, ZT10) and 5-day dKO livers. Differentially expressed genes were filtered based on fold change greater than 1.5 relative to controls with FDR<.05. Inset indicates Top 5 Reactome Pathway terms for genes downregulated in both GR-KO and Ncor1/2 dKO livers.
