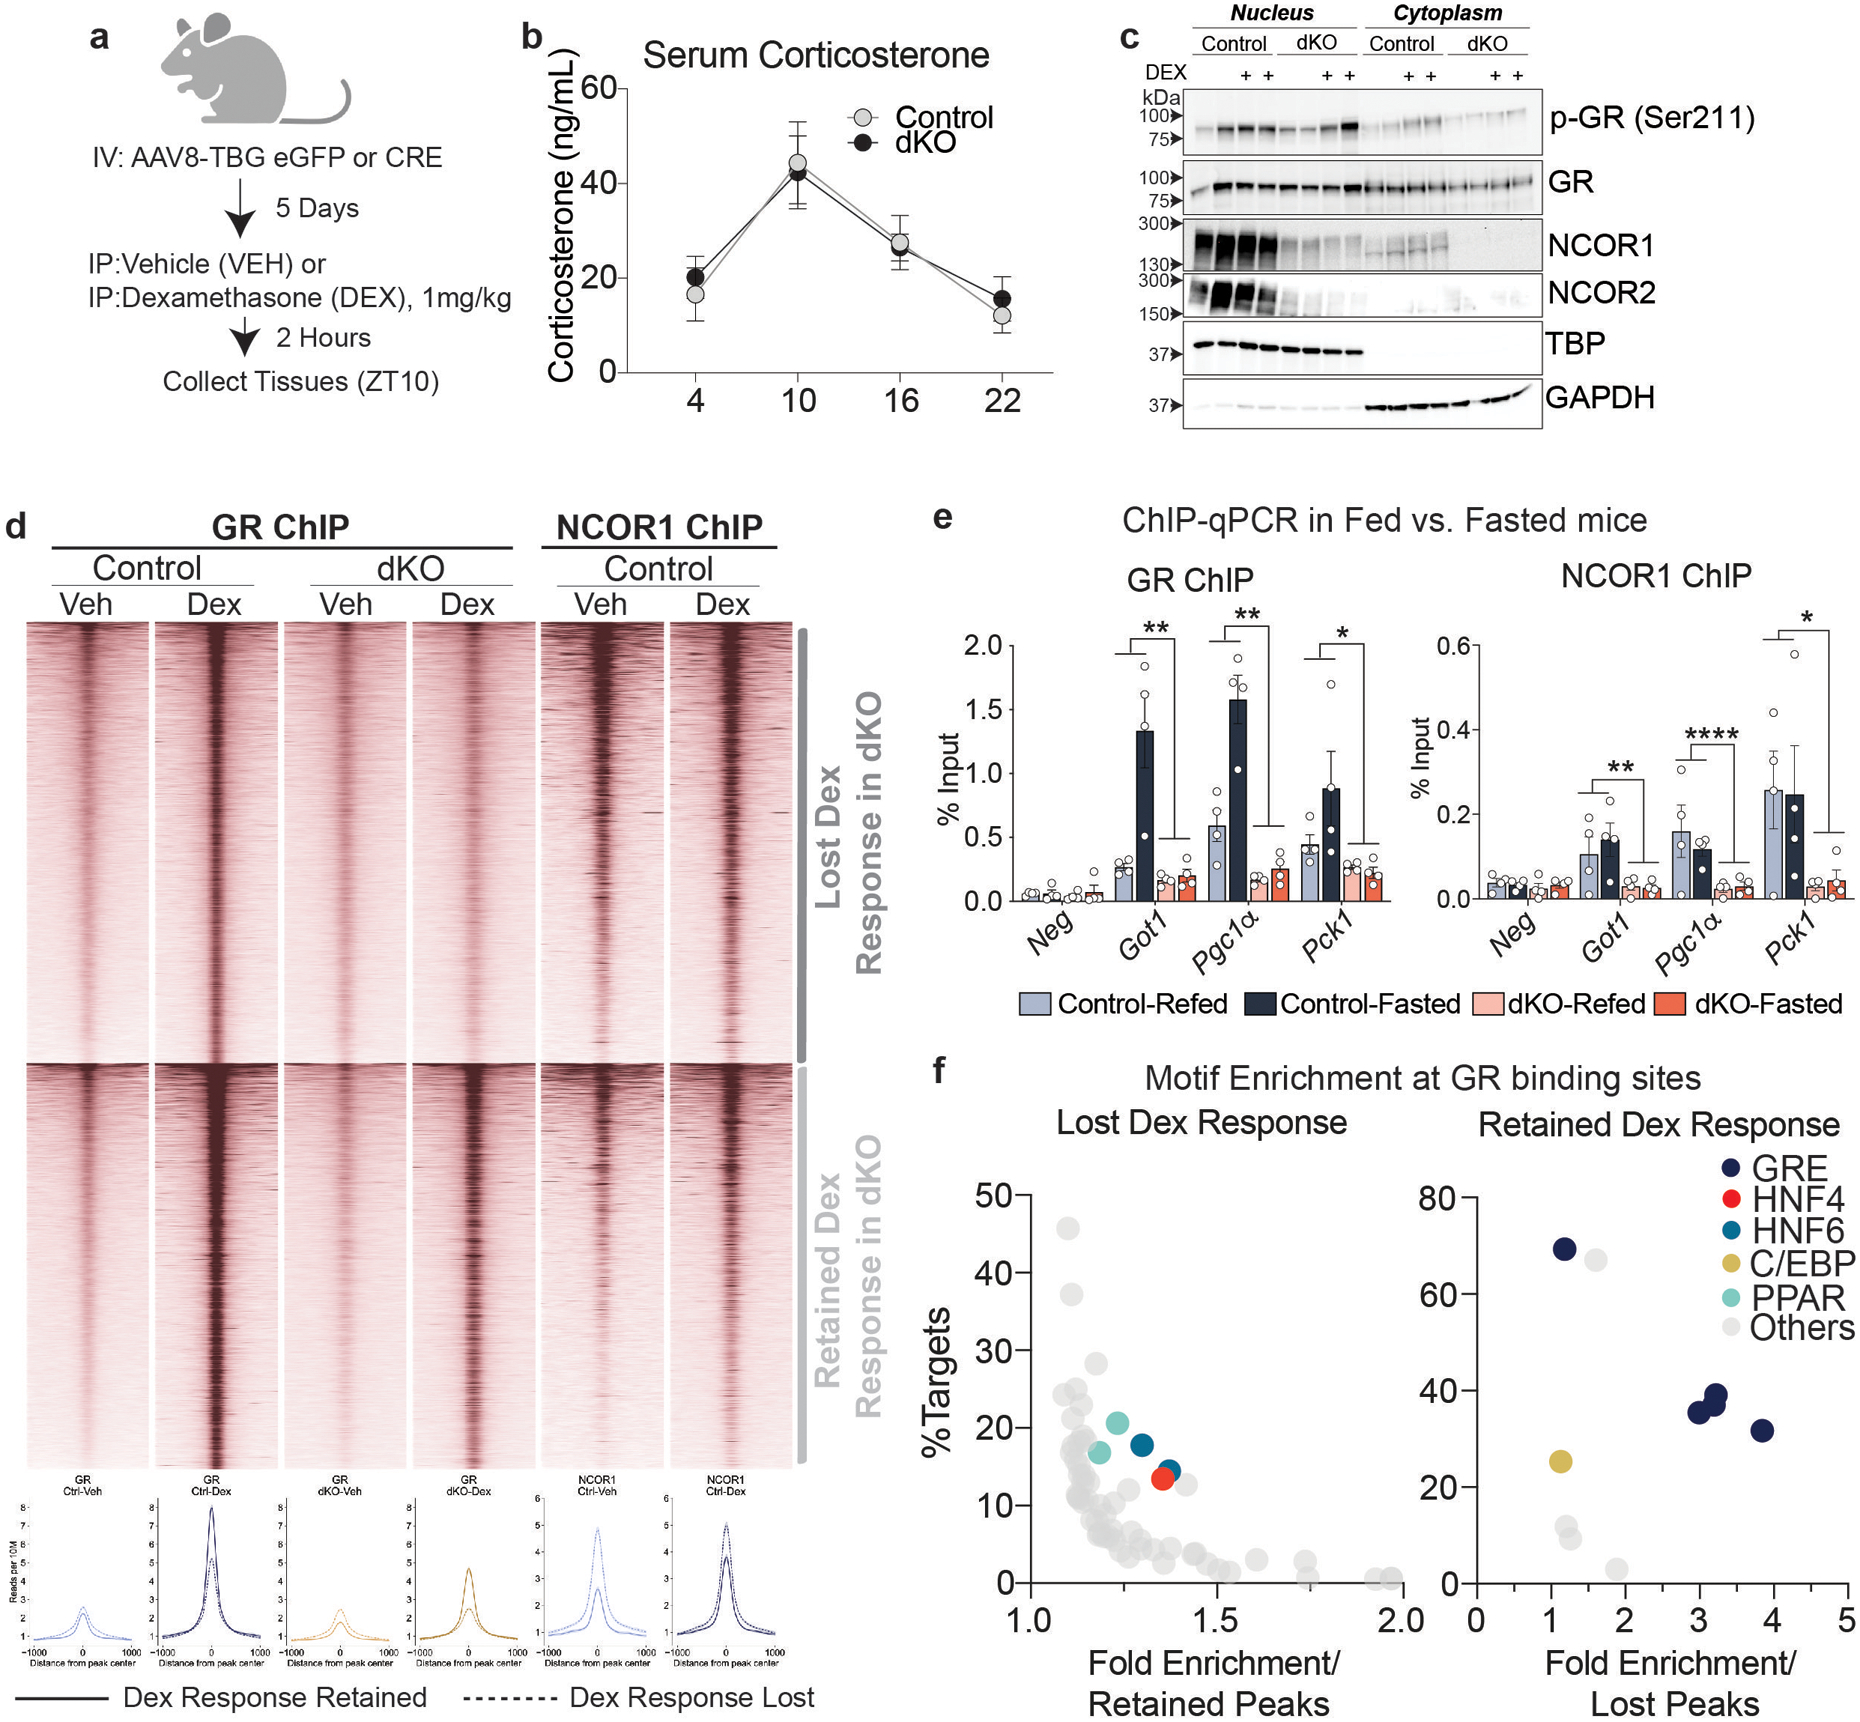
Extended Data Figure 8. NCORs are required for GR binding and transcriptional activity at NCOR1/GR cobound sites.

a, Experimental design (Created with BioRender.com). 5 days after AAV injection, mice were injected intraperitoneally with 1 mg/kg Dexamethasone (Dex) or vehicle (sterile saline). Mice were euthanized 2 hours after Dex administration (ZT10). b, Serum Corticosterone levels in control and dKO mice, measured serially over 24 hours (Control (n=6 mice) dKO (n=8 mice) and plotted as mean +/− S.E.M. c, Representative western blot of nuclear and cytoplasmic extracts (total of 4 samples were assayed). Samples were loaded into 3 separate gels and equal loading was confirmed by TBP and GAPDH blots on each membrane. d, Heatmap of all GR ChIP peaks induced by Dex treatment in control mice. Lower panel shows average ChIP profile of peaks with lost Dex response vs. retained Dex response GR binding. e, GR and NCOR1 ChIP-qPCR in animals fasted for 24 hours (fasted) and animals fasted for 24 hours and refed for 3 hours (Fed) at example loci exhibiting a blunted response to Dex treatment. Data shown as percent enrichment relative to input. Biological replicates are plotted (n=4 mice per group) as mean +/− S.E.M. and p-values for Genotype effect were calculated by two-way ANOVA: GR ChIP Got1 p=.0071, Pgc1α p=.0051, Pck1 p=.0137 and NCOR1 ChIP Got1 p=.0013, Pgc1α p<.0001, Pck1 p=.0174) f, Motif analysis at sites with lost Dex-induced GR binding and those with retained GR binding. X-axis indicates the fold enrichment relative to either retained or lost peaks, y-axis indicates % of peaks with that motif.
