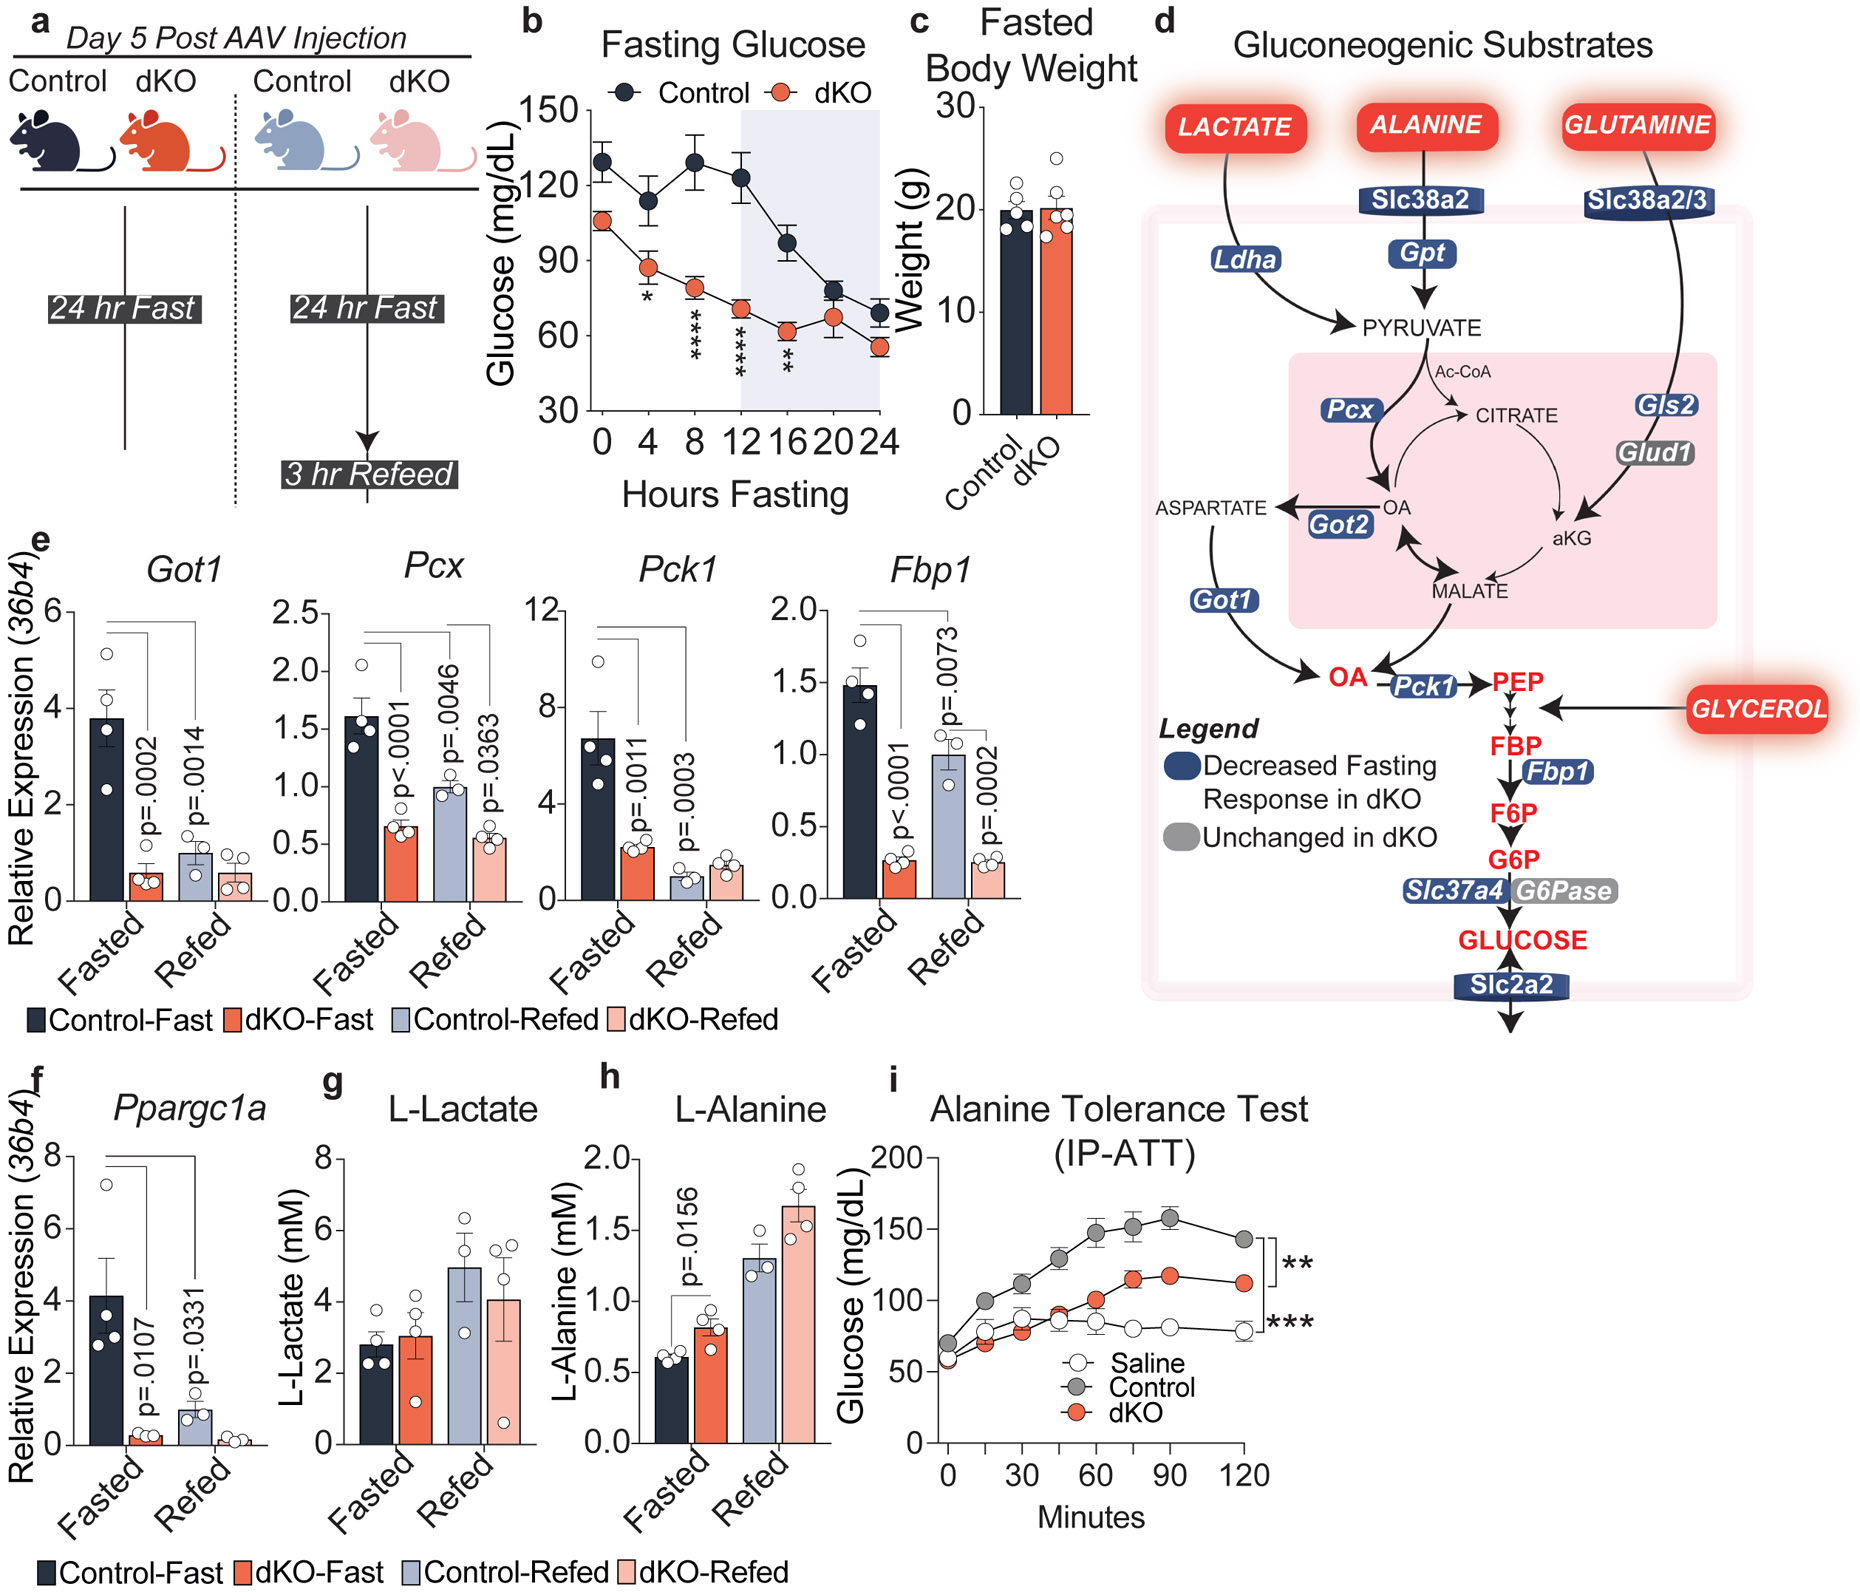
Figure 2. NCORs are required for the hepatic fasting response.

a, Experimental Design, created with BioRender.com. 5 days after AAV administration, control and dKO mice were fasted for 24 hours or fasted for 24 hours and refed for 3 hours. b, Fasting glucose throughout a 24 hour fast in control (n=6 mice) and dKO animals (n=7 mice). P-values calculated by RM two-way ANOVA with Šídák’s multiple comparisons test: (ZT4 p=.0445, ZT8 p<.0001, ZT12 p<.0001, ZT16 p=.0026). c, Body weight of 24 hour fasted animals (n=5-6 animals) d, Schematic of major substrates contributing to hepatic gluconeogenesis. All factors shown in blue exhibit impaired transcriptional response to fasting. e,f, RT-qPCR of primary gluconeogenic factors relative to 36b4. p-values were calculated by two-way ANOVA with Turkey’s test for multiple comparisons. g, Serum L-lactate levels (mM). h, Serum L-alanine levels (mM). p-values for g-h calculated by students unpaired two-tailed t-test. For panels e-h, biological replicates representing individual mice are plotted: Control-Fast (n=4), dKO-Fast (n=4), Control-Refed (n=3), dKO-Refed (n=4). i, Alanine Tolerance Test. Experiment was performed twice. Control- saline (n=5 mice), Control-Alanine (n=11 mice), dKO-Alanine (n=6 mice). Data was analyzed by two-way ANOVA (Control:dKO p=.0013, Control:Saline p=.0005). For all panels, data are presented as mean values +/− S.E.M.
