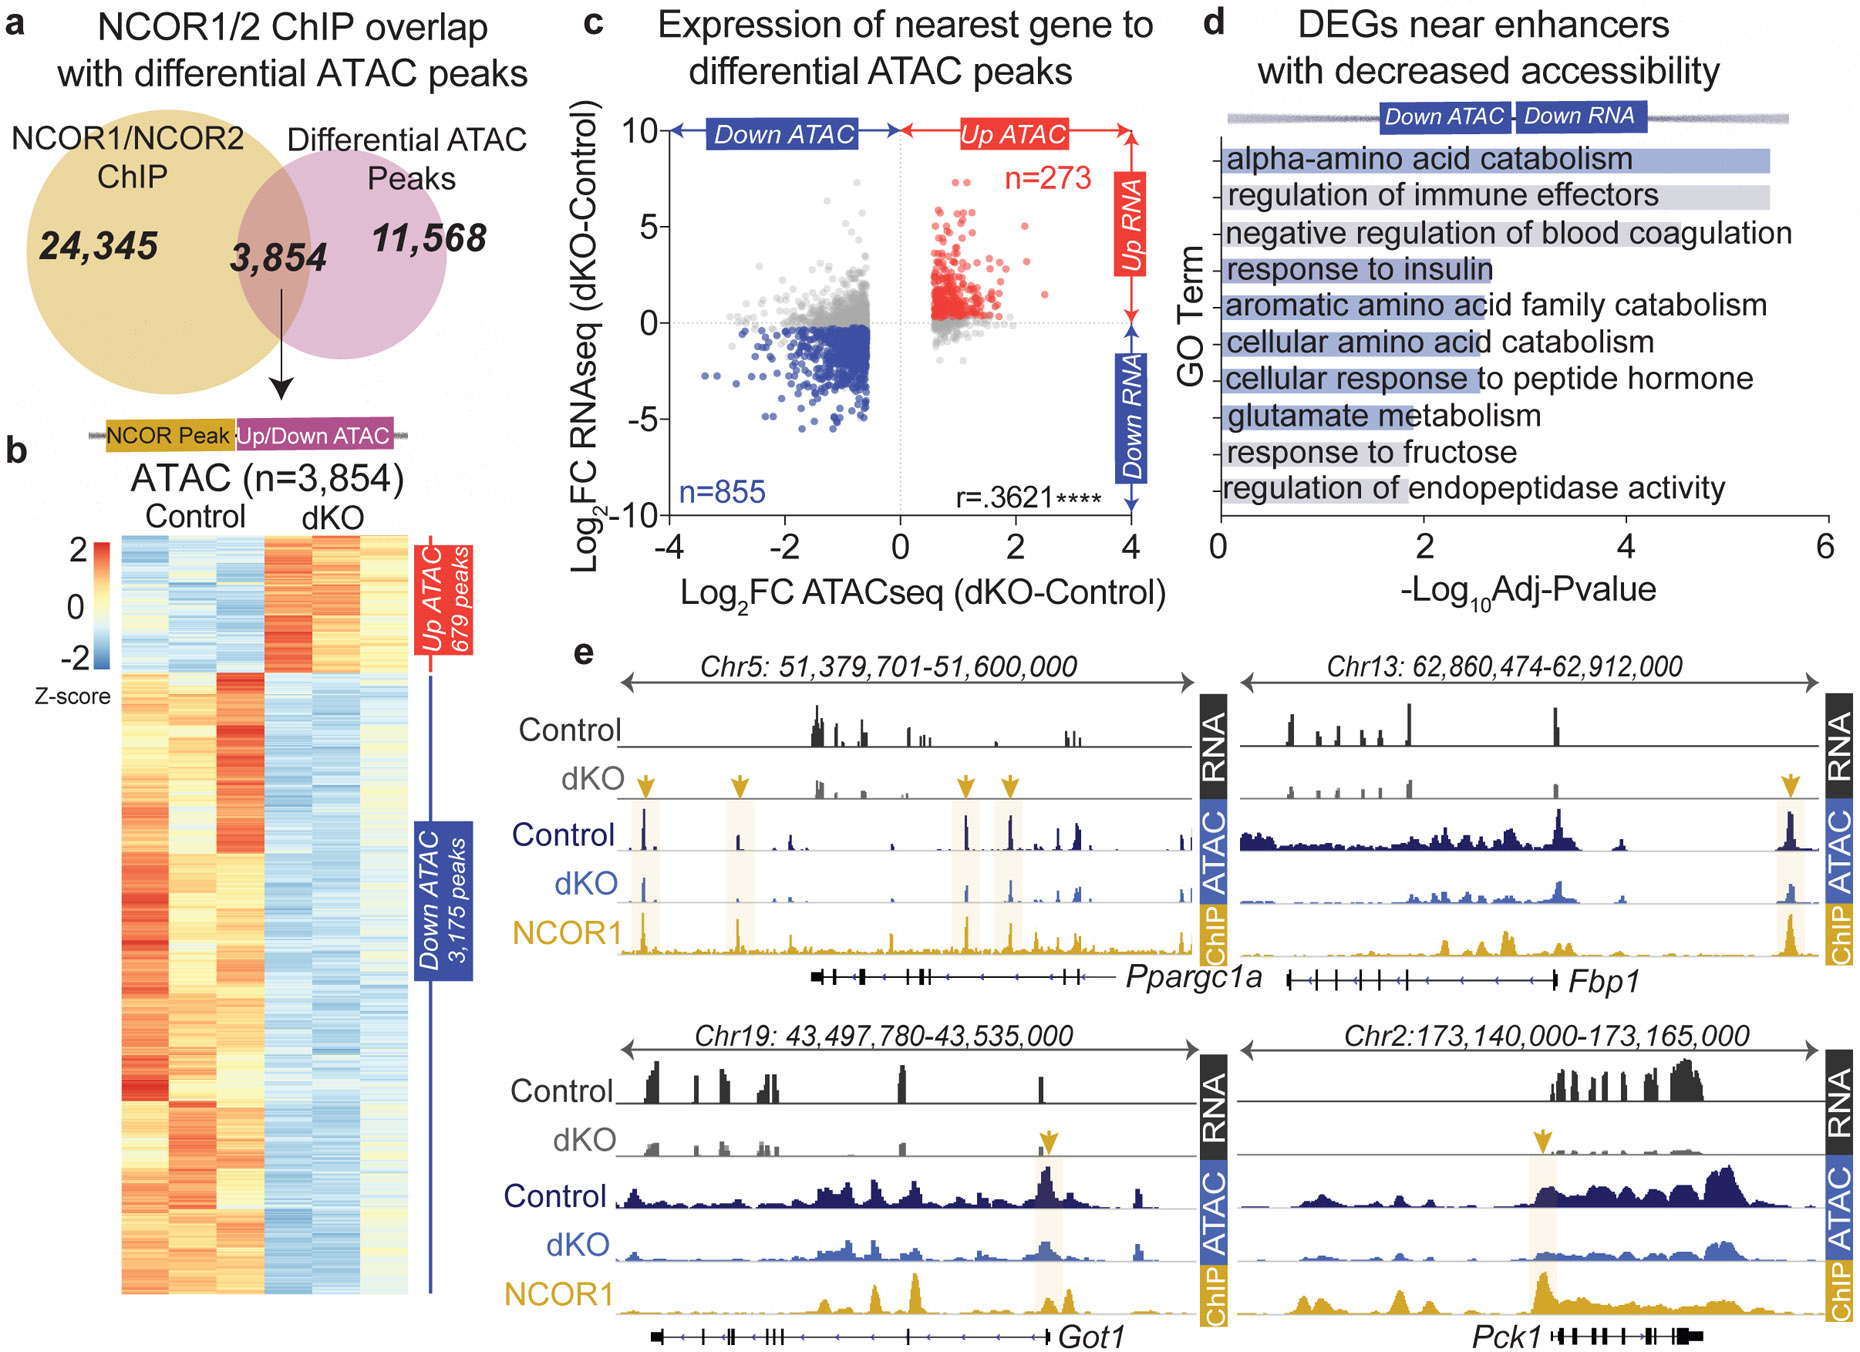
Figure 3. Loss of hepatic NCORs results in decreased chromatin accessibility at enhancers of glucoregulatory genes.

a, (upper). Venn diagram of ChIP peaks for NCOR1 (GSM647027) or NCOR2 (GSM1236494) and differential ATAC peaks (Differential ATAC peaks were filtered based on fold change>1.5 compared to control samples with FDR <.05). (lower) Z-score normalized heatmap showing ATACseq signal for genomic regions identified in Venn overlap (panel a). These correspond to 3,854 NCOR1/2 binding sites that exhibited changes in chromatin accessibility in the dKO. b, Pearson’s Correlation of RNAseq (dKO day 5) and differential ATAC peaks bound by NCOR1/NCOR2 (sites identified in Venn overlap from panel a), p<.0001. ATAC peaks were filtered with a 200kb cutoff to nearest gene and differential gene expression was filtered based on FDR<.05, FC≥1.2. c, −Log10(FDR) of Top ontology terms (GO: Biological Process) of downregulated genes nearest to the 855 enhancers bound by NCOR1/2 with decreased accessibility. d, Example tracks of loci with enhancers exhibiting decreased accessibility and decreased gene expression. RNAseq tracks (control and dKO day 5 livers, group autoscaled), ATACseq tracks (hepatocytes isolated from control and dKO day 5 livers, group autoscaled) and NCOR1 ChIPseq (control livers, ZT10, autoscaled) are shown.
