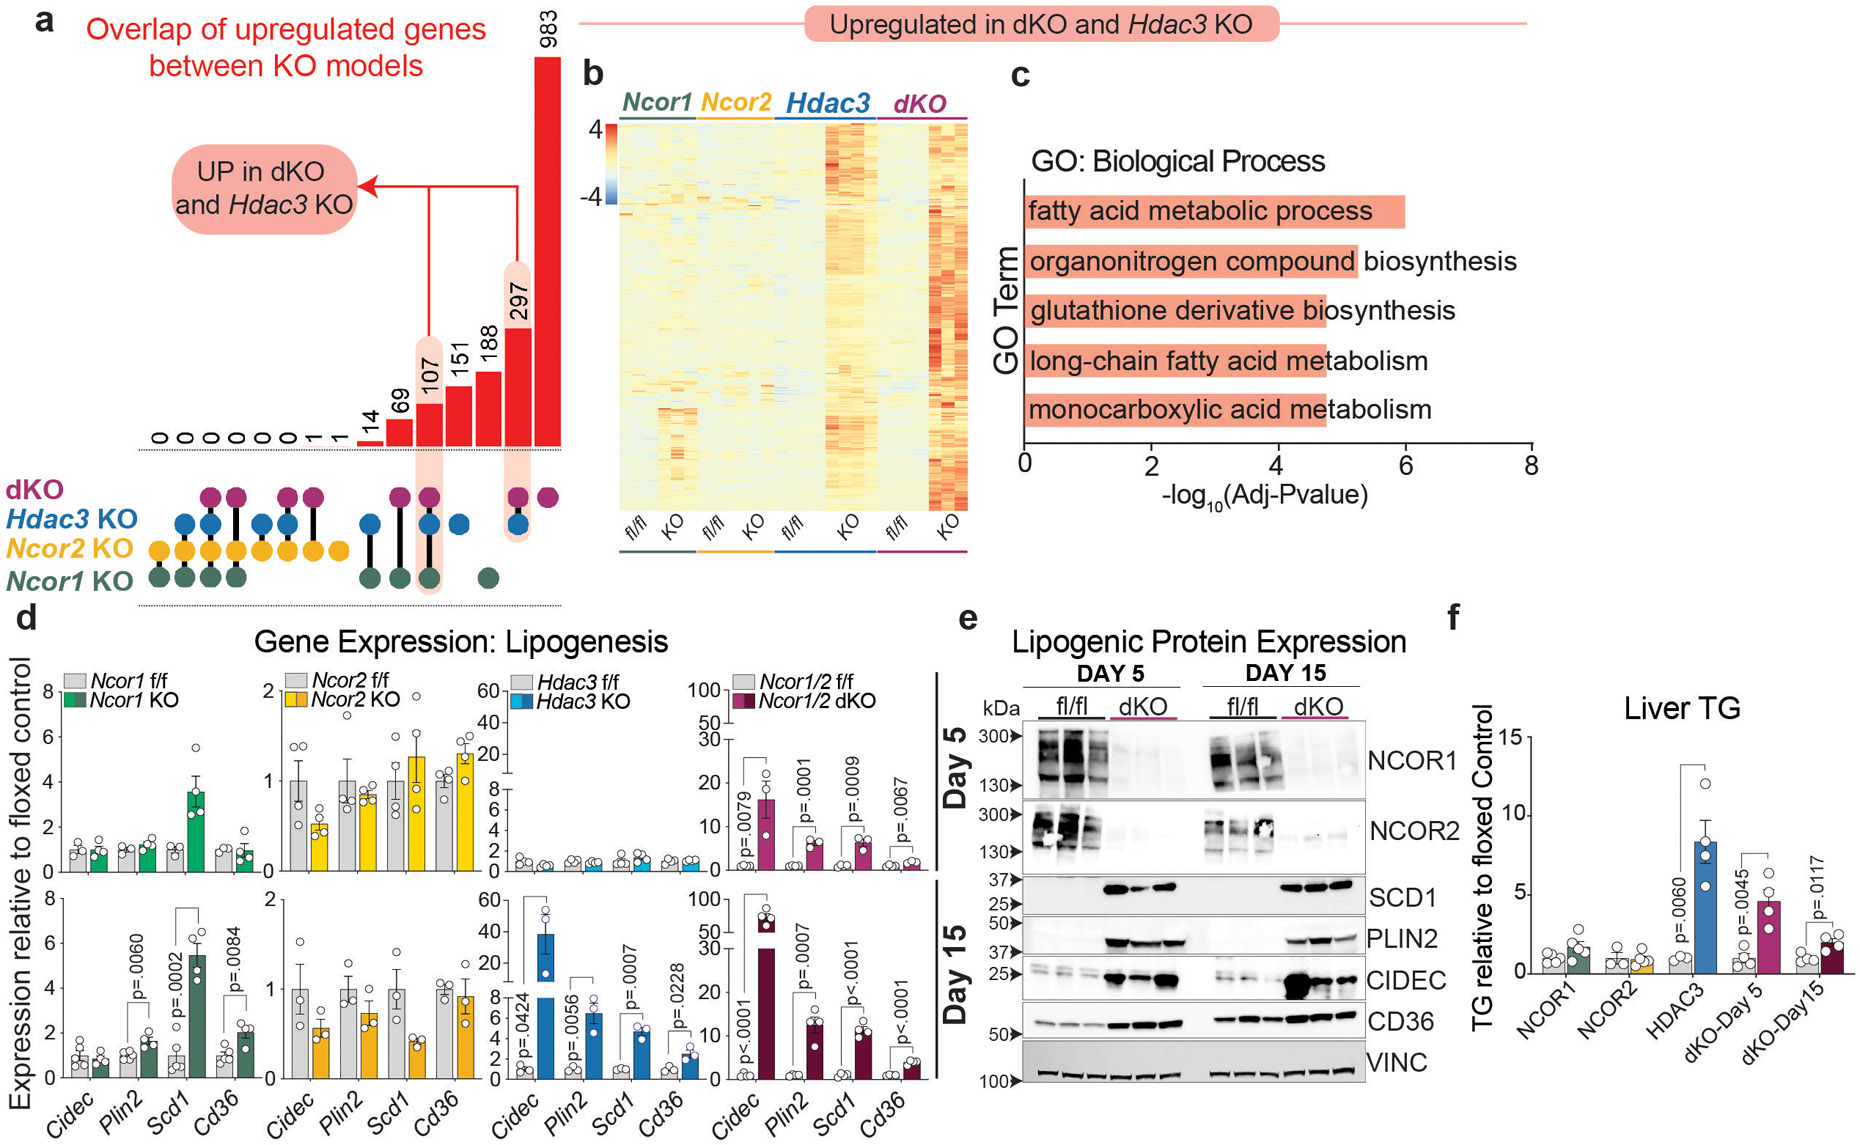
Extended Data Figure 2. Lipogenic gene induction in both NCOR1/2 dKO and HDAC3 knockout livers.

a, Upset plot showing overlap of upregulated genes (fold change>1.5 relative to floxed control, adj p-value <.05) between each knockout model: (dKO-5 day, purple dots), Hdac3 KO (blue dots), Ncor2 KO (yellow dots), and Ncor1 KO (green dots). Each linkage represents common differentially expressed genes between the indicated groups. b, Z-score normalized heatmap of all genes upregulated (Adj Pvalue <.05, Fold Change >1.5) in both Hdac3 KO and dKO models. c, Top ontology terms (GO:Biological Process) for all genes upregulated in both Hdac3 KO and dKO models. d, RT-qPCR of a panel of lipogenic genes relative to 36b4. Data represented as fold change relative to floxed control and plotted as mean +/− S.E.M. p-values were calculated by unpaired two-tailed students t-test with correction for multiple comparisons using the Holm-Šídák method. Biological replicates are plotted (n=3-5 animals) e,Western blot of lipogenic factors and day 5 and 15 post dKO. The same samples were loaded into 4 separate gels. Equal loading was confirmed by Vinculin blotting on each membrane. f, Liver triglyceride relative to fl/fl control for each model. 5 days and 15 days post AAV injection for (dKO) and 15 days post AAV injection (Hdac3 KO, Ncor1 KO, Ncor2 KO). Data represented as fold change relative to mean of floxed control. Biological replicates are plotted (n=3-5 animals) as mean +/− S.E.M. p-values were calculated by unpaired two-tailed students t-test.
