
Extended Data Figure 4. Inhibition of HDAC3 activity does not have a major effect on hepatic glucose metabolism.
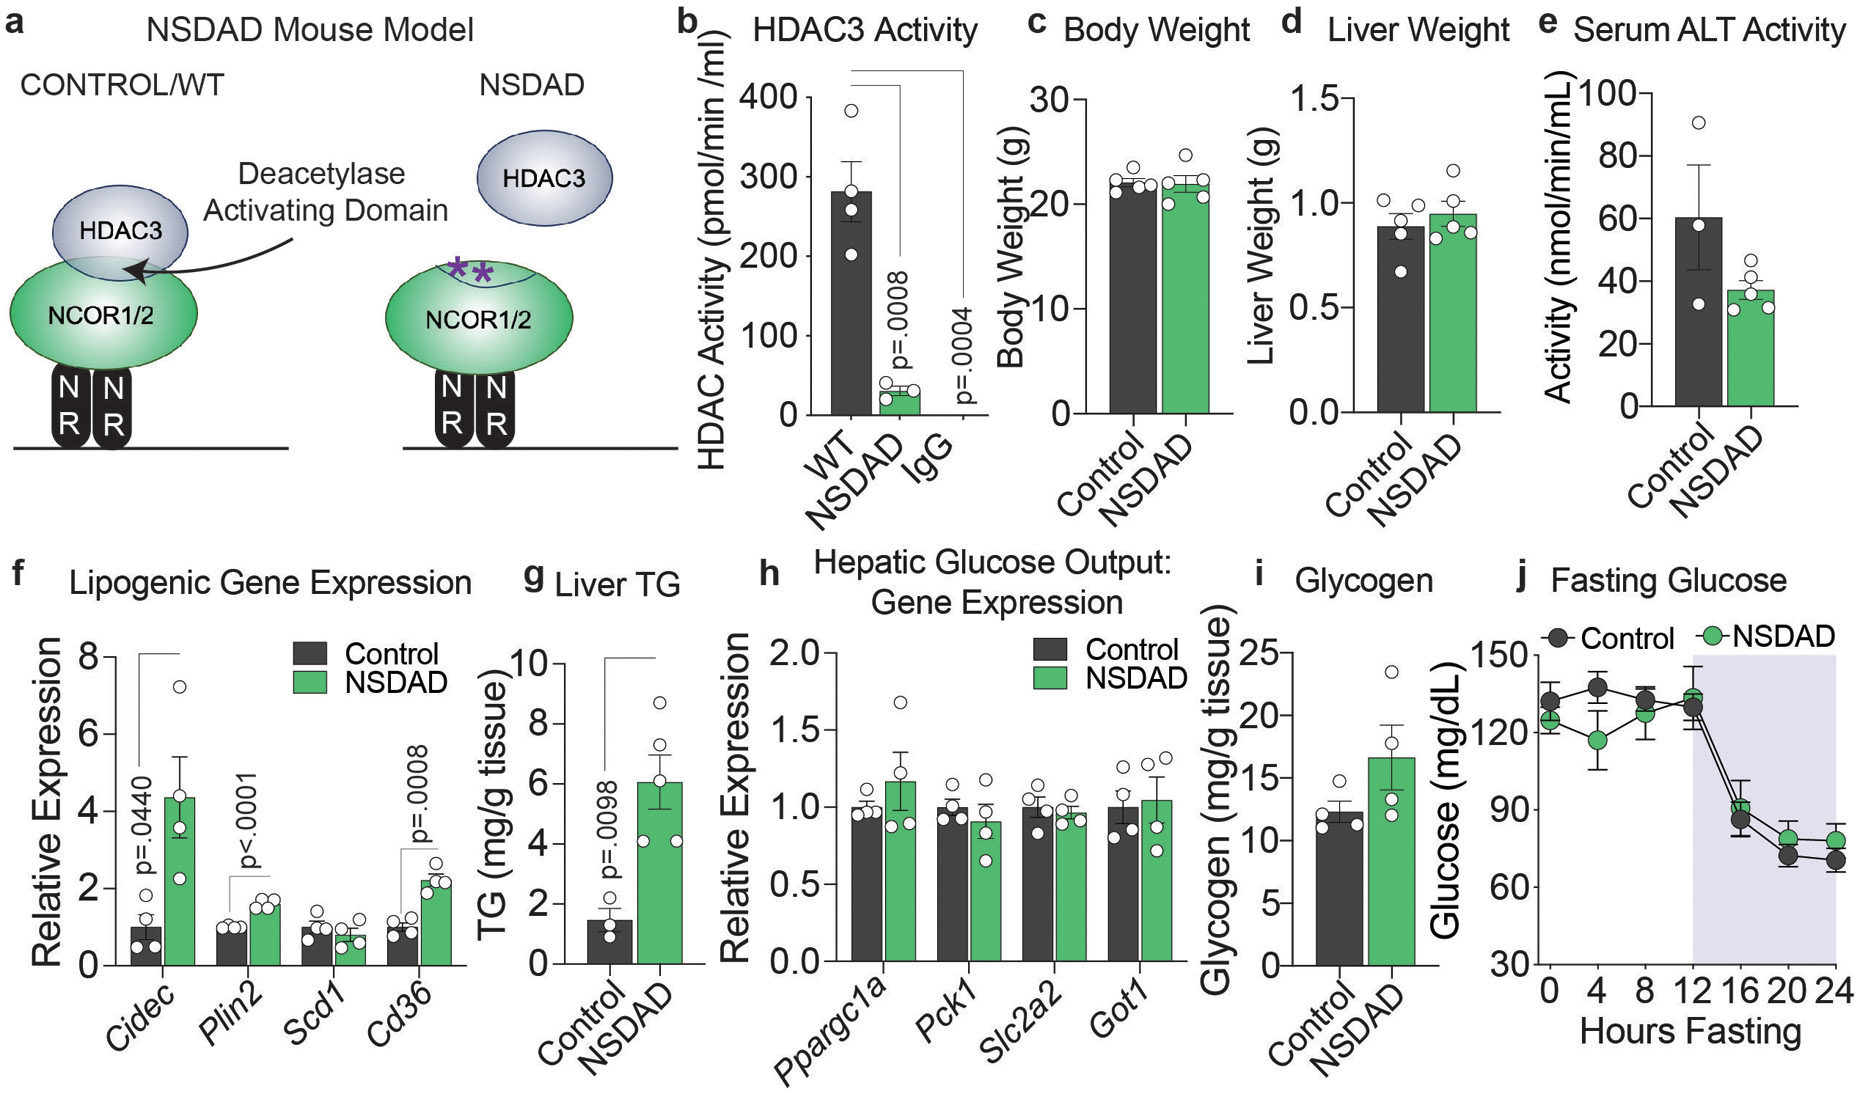
a, Schematic of NSDAD mouse model. b, HDAC activity in HDAC3 immunoprecipitates from Control (WT) (n=4 mice) and NSDAD (n=3 mice) mice. P values calculated by one-way ANOVA with Turkey’s multiple comparisons test. IP with normal rabbit IgG (IgG) in control mice is a negative control (n=3 mice). c, Body weight and d, liver weight of control (n=5 mice) and NSDAD (n=5 mice) mice. e, Serum ALT Activity (n=3 control and 5 NSDAD mice). f, RT-qPCR of Lipogenic Gene Expression relative to 36b4 (n=4 mice). P values calculated by unpaired two-tailed student’s t-test with correction for multiple comparisons using the Holm-Šídák method. g, Hepatic triglyceride levels (n=4 mice) P value calculated by unpaired two-tailed student’s t-test . h, RT-qPCR of hepatic glucose output genes relative to 36b4 (n=4 mice). i, Hepatic glycogen levels (n=4 mice). j, Glucose levels during a 24 hour fast: WT (n=6 mice), NSDAD (n=5 mice). For all panels, the mean +/− S.E.M. is plotted.