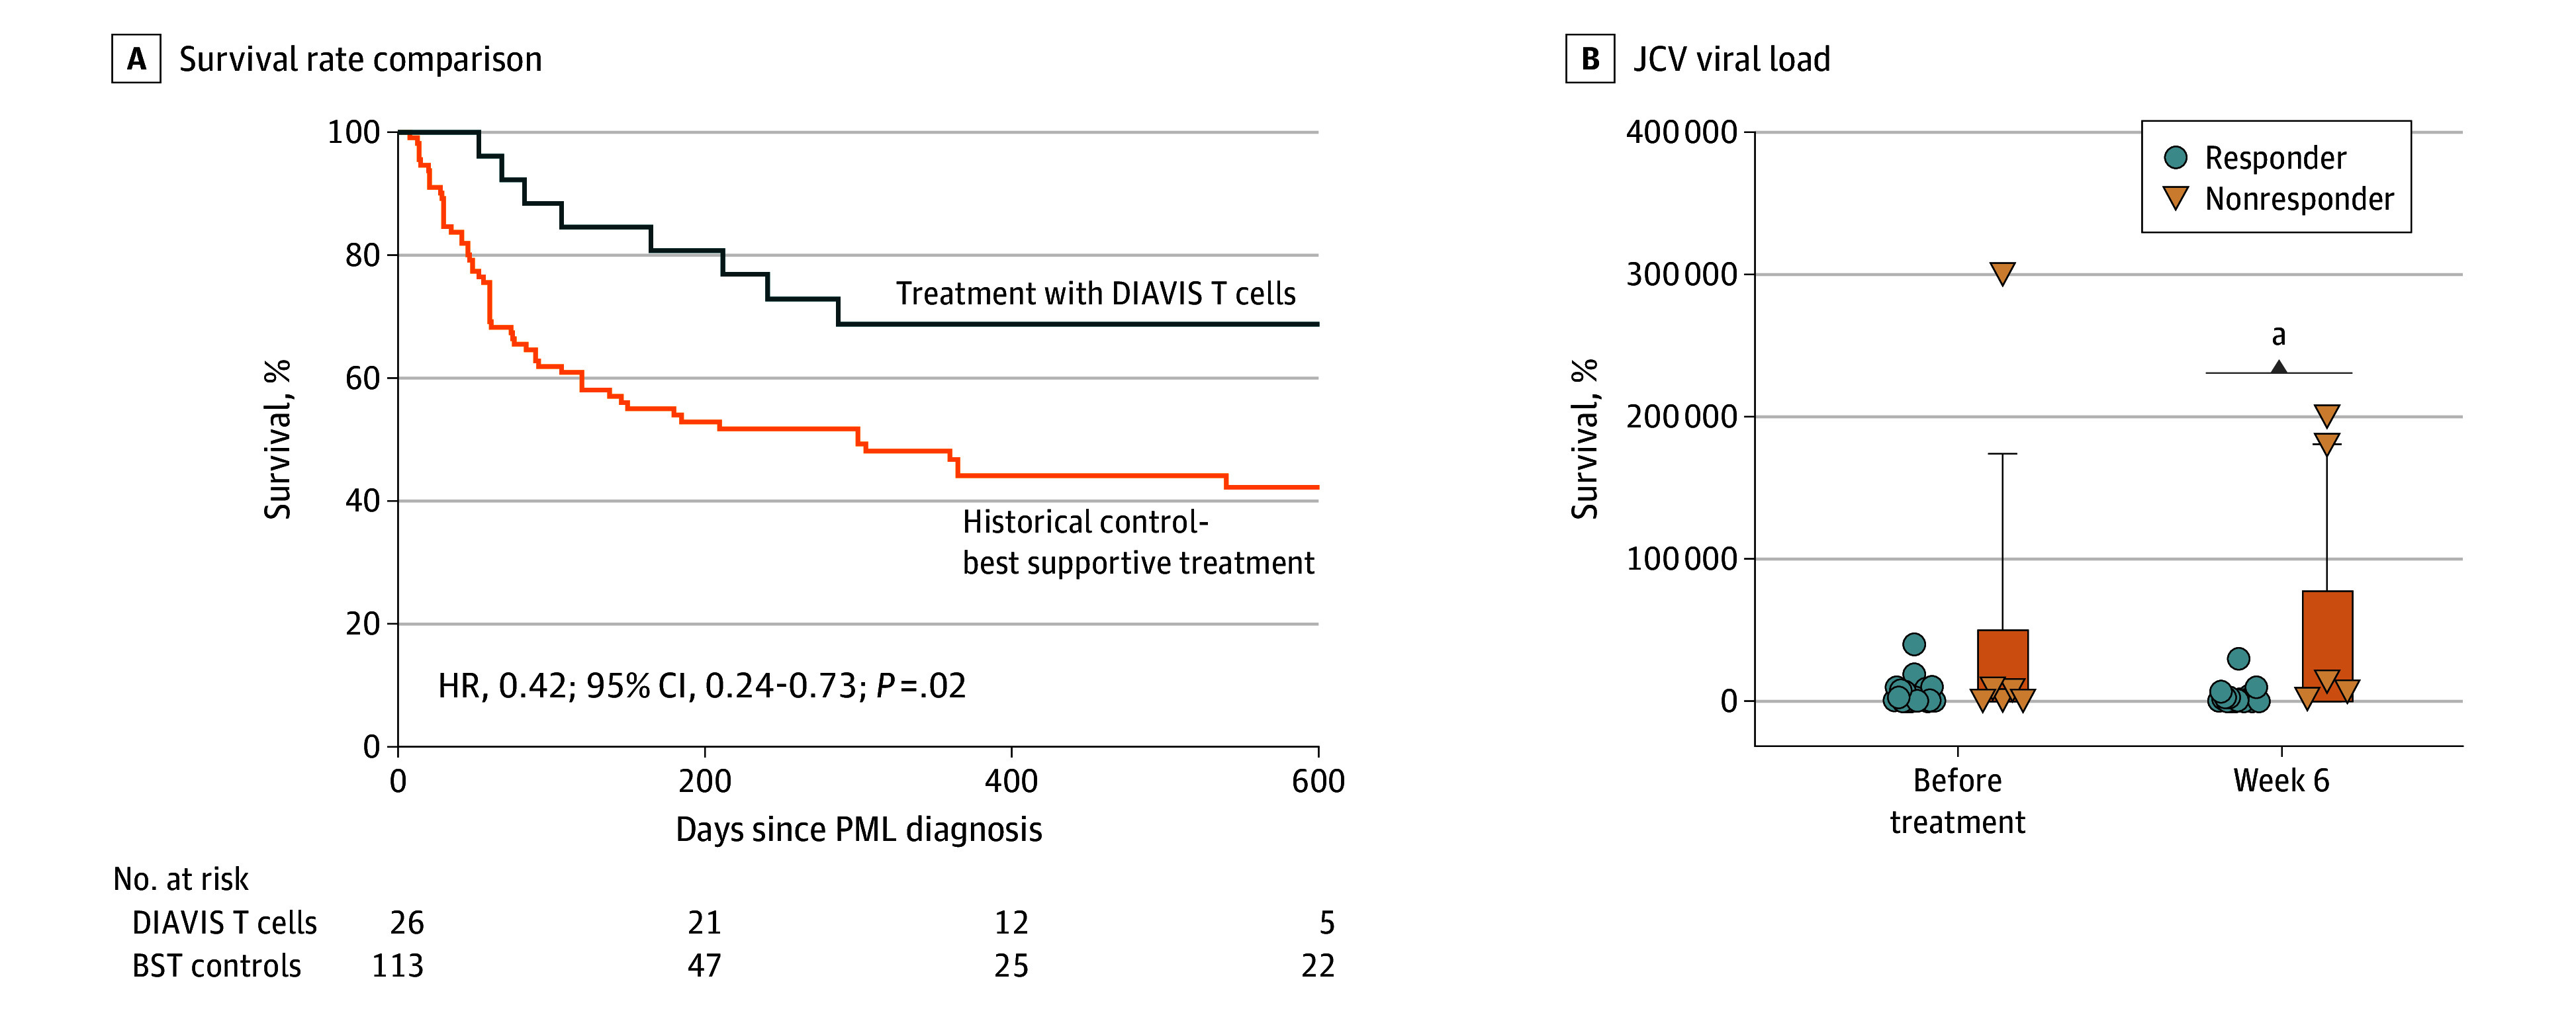
Figure 2. Comparison of Survival Rates Against Best Supportive Treatment (BST) Controls and Comparative Analysis of Responders and Nonresponders Treated With Directly Isolated Allogeneic Virus–Specific (DIAVIS) T Cells.

A, Comparison of the survival curves of patients treated with DIAVIS T cells with those of historical controls who received BST. B, Cerebrospinal fluid (CSF) values of JC polyomavirus (JCV) viral load in treatment responders and nonresponders comparing the changes observed in viral load from pretreatment to week 6 in both groups showing mean with SD. Week 6 = median day 43 (IQR, 40-48 days; minimum to maximum, 13-65 days). HR indicates hazard ratio; PML, progressive multifocal leukoencephalopathy.
aP =.004
