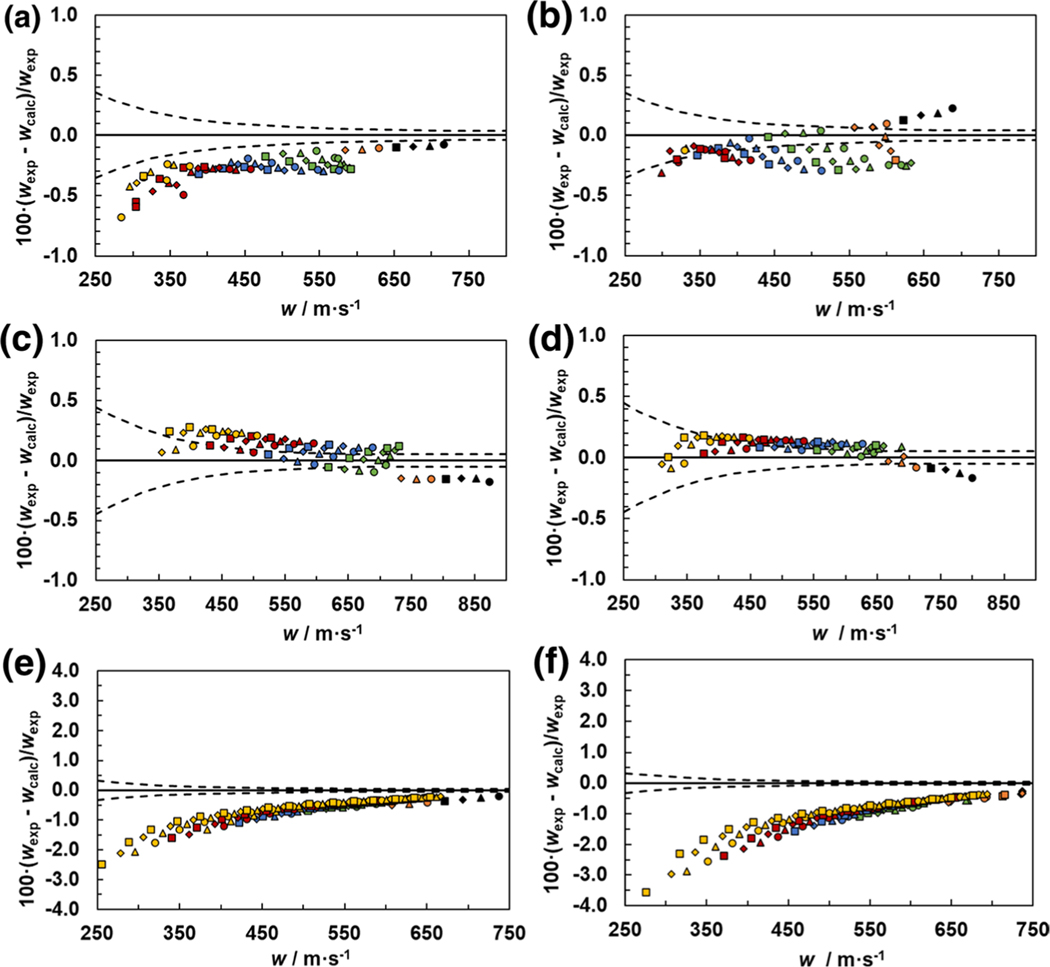
Fig. 2.
Deviation graphs comparing experimental speed of sound values, , to speed of sound values calculated using REFPROP [6] mixture models that incorporate pure-fluid EOS [7–11] and fitted binary interaction parameters [12, 13], , as a function of . Dashed lines represent the experimental uncertainty of the speed of sound data as a function of the speed of sound. The systems and molar compositions are (a) R-125/1234yf (0.33351/0.66649), (b) R-125/1234yf (0.66643/0.33357), (c) R-1234yf/152a (0.33342/0.66658), (d) R-1234yf/152a (0.66526/0.33474), (e) R-1234ze(E)/227ea (0.33265/0.66735), and (f) R-1234ze(E)/227ea (0.66803/0.33197). Comparisons are shown at temperatures,  , 230 K;
  , 235 K;
  , 240 K;
  , 245 K;
  , 250 K;
  , 255 K;
  , 260 K;
  , 265 K;
  , 270 K;
  , 275 K;
  , 280 K;
  , 285 K;
  , 290 K;
  , 295 K;
  , 300 K;
  , 305 K;
  , 310 K;
  , 315 K;
  , 320 K;
  , 325 K;
  , 330 K;
  , 335 K;
  , 340 K; and
  , 345 K (Color figure online)

