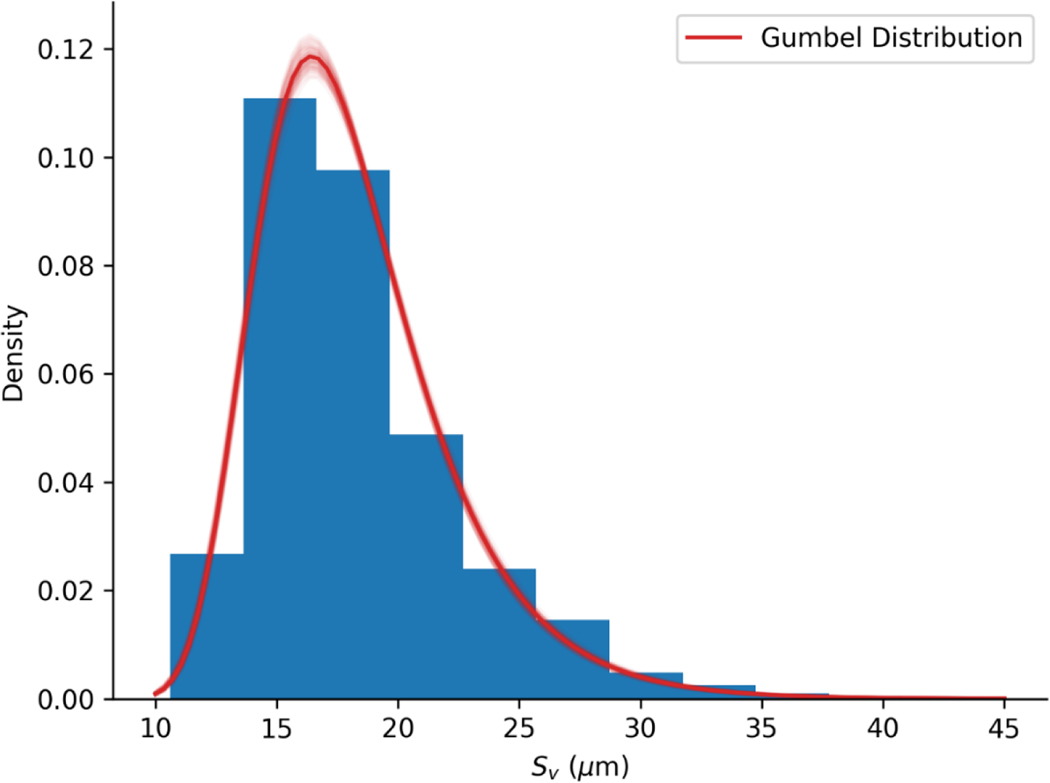
Figure 6.
Histogram of values in the FoV dataset, the Gumbel distribution fitted to them (dark red curve, and uncertainty associated with the fitted Gumbel distribution (light red curves). Uncertainty is depicted by 50 replicate Gumbel distributions, where a replicate is obtained by perturbing the maximum likelihood estimates of and by a multivariate normal vector with mean zero, and covariance matrix given by the negative inverse of the Hessian matrix of the likelihood function evaluated at its maximum.

