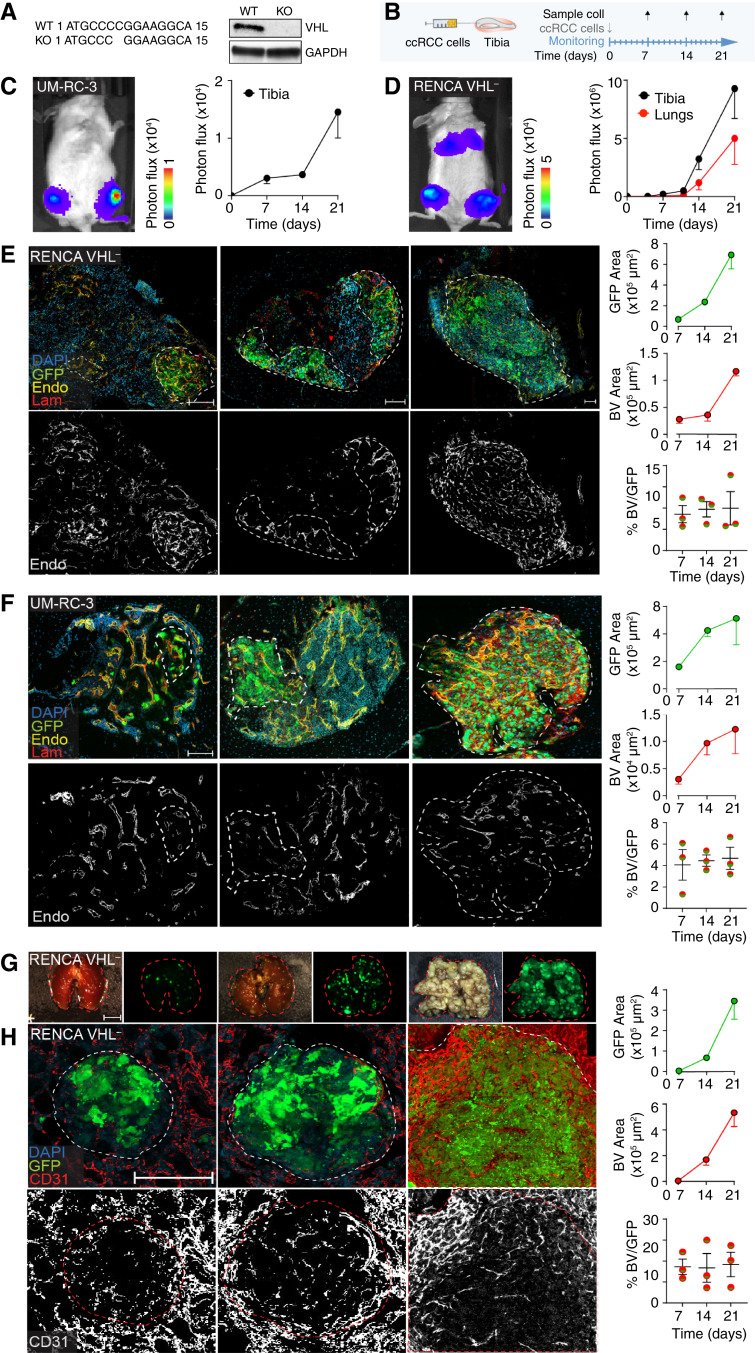
Figure 1.
Development of ccRCC models in bone. A, WT and KO sequence of the vhl gene of RENCA cells and Western blot analysis of VHL protein expression compared with the housekeeping protein, GAPDH. B, Schematic representation of the experimental models. Tumor cells were implanted into the tibia, and tissues were collected 7, 14, and 21 days after implantation. C and D, Tumor progression [UM-RC-3 (C) and RENCA VHL− (D) monitored in vivo by bioluminescence, mean ± SEM, n = 8–10 tibiae/group]. E and F, Confocal microscopy analysis of tumors in tibiae (RENCA VHL−, E; UM-RC-3, F). A quantification of tumor (green, GFP) and blood vessel (endomucin, yellow; laminin, red) areas over time is shown. Nuclei (blue, DAPI). Bar, 100 µm, mean ± SEM, n = 8–10 tibiae/group. G, Stereomicroscope images of lungs (brightfield and GFP); bar, 0.5 cm. H, Confocal microscopy analysis of tumors in lungs (RENCA VHL−); a quantification of tumor (green, GFP area) and blood vessel (CD31, red) areas over time is shown. Nuclei (blue, DAPI). Bar, 100 µm. Mean ± SEM, n = 8–10 tibiae/group. BV, blood vessel; Endo, endomucin; Lam, laminin; WT, wild-type.

