Figure 7.
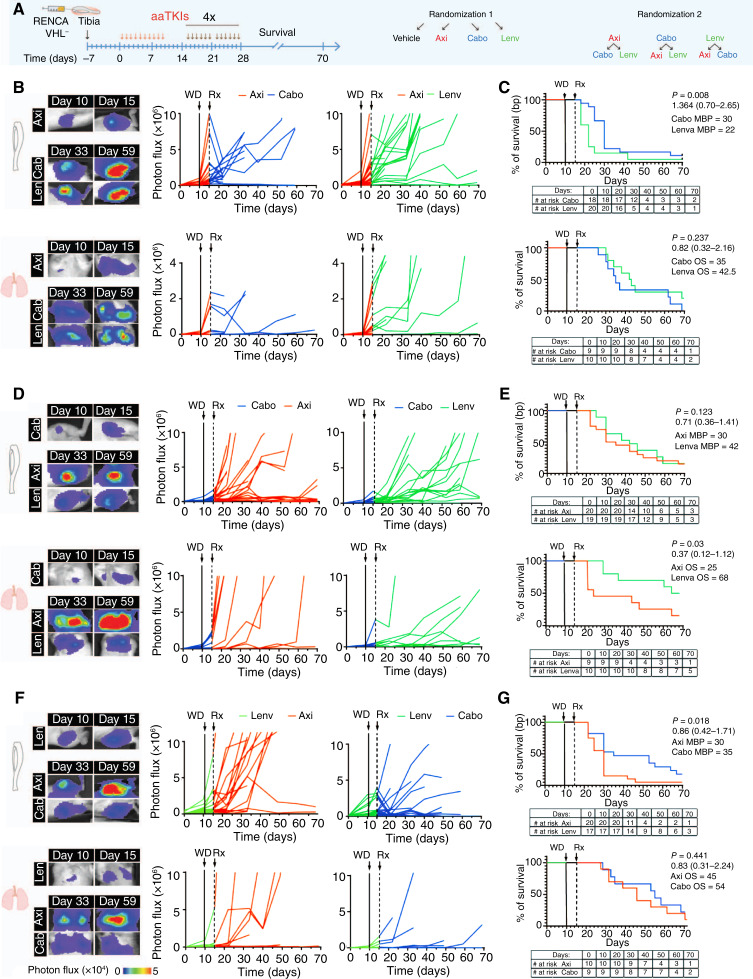
TKIs as a second-line treatment. A, Schematic representation of experimental design. B, D, and F, Representative images of bioluminescence signal in tibiae/lungs of mice and bioluminescence signal of tumors quantified over time; single tumors are shown. C, E, and G, Estimation of survival over time after TKI treatment based on bone and lung tumors. Absolute numbers are reported in the table. P value (one-way ANOVA with Tukey honestly significant difference post hoc test) with median OS and 95% CI of ratio after the log-rank (Mantel–Cox) test. Axi, axitinib; Cabo, cabozantinib; Lenv, lenvatinib; MBP, median bone progression; Rx, second-line treatment; WD, withdrawal.

