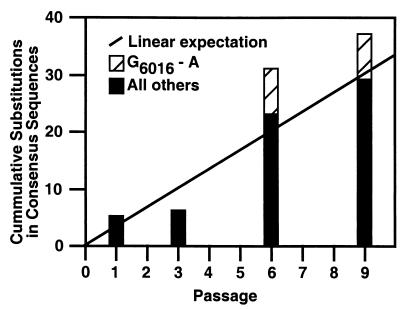
FIG. 3.
Histogram of cumulative substitutions in consensus sequence summed for nine lineages derived from an LDSI of WSMV Sidney 81. The total bar height corresponds to the frequency of all substitutions in consensus sequences sampled after 1, 3, 6, and 9 passages. Black regions of bars correspond to all consensus sequence substitutions other than the near-global reversion (G6016→A) which occurred in eight of nine lineages (hatched region of bars). The line denotes the linear-expectation best fit to the observed data (excluding G6016→A) that intersects the origin (no mutations at time of limiting dilution inoculation).

