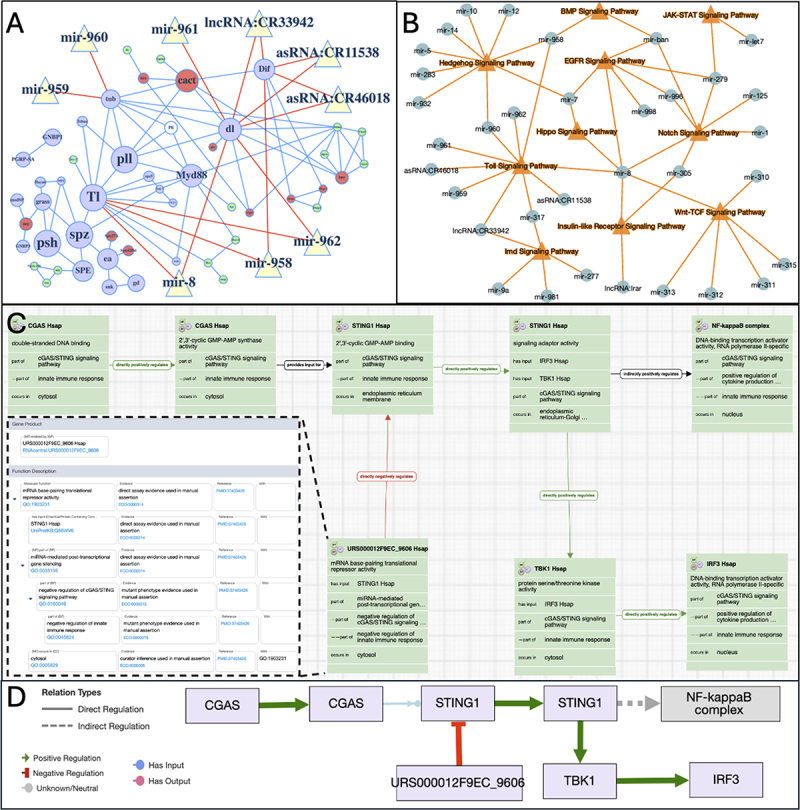
Figure 4.

Modeling ncRNA interactions with signalling pathways using GO data. (A) A cytoscape.Js rendering of the FlyBase Drosophila Toll Signaling Pathway (FBgg0001059) network. ‘Core’ pathway components are shown in mauve, positive regulators in green, negative regulators in red, context-dependent regulators in white. The size of circular nodes (protein coding genes) is determined by the experimental data supporting pathway assignment [62]. The edges between nodes derived from physical interaction data. Regulatory ncRNAs are depicted by cream triangles (of uniform size, unrelated to support) and red lines connect them to their targets. (B) Intersection of ncRNAs with pathways in Drosophila based on pathway data curated by FlyBase using the GO. Signaling pathways are shown by orange triangles and ncRNAs by green circles. Multiple regulatory ncRNAs have been experimentally shown to interact and regulate each pathway. Some ncRNAs can target multiple pathways. (C) ‘Model of MiR-4691-3p inhibition of cGAS-sting signaling in the cytosol (human)’ gomodel:654d809000000802 in the noctua visual pathway Editor curation interface, showing the intersection of miR-4691-3p (RNAcentral:URS000012F9EC_9606) with the cGAS-sting pathway by the post-transcriptional gene silencing of STING1. The expanded box section shows the detailed annotations and evidence that is associated with the miR-4691-3p. (D) A simplified view of the GO-CAM shown in panel C rendered in cytoscape can be used to present the pathway constructed in the noctua curation interface. Currently these models can be viewed in AmiGO (https://amigo.geneontology.org/amigo/model/654d809000000802) and on Alliance gene page pathway tab (e.g. https://www.alliancegenome.org/gene/HGNC:21367#pathways).
