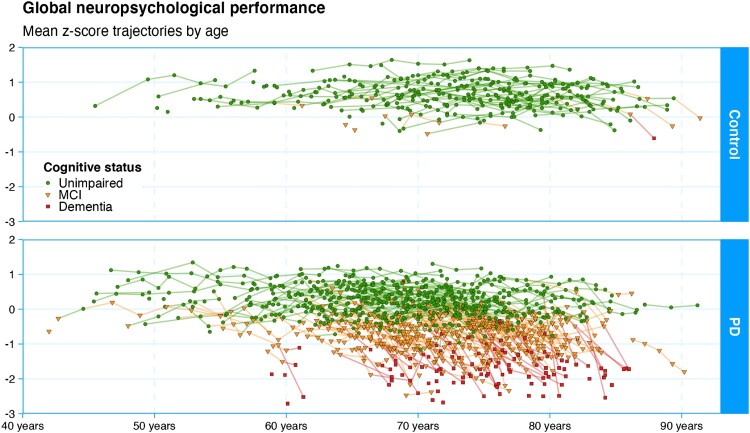
Figure 3.
Here we depict the core dataset of the study: individual trajectories of cognitive status from all participants. Each point represents a summary measure of one participant’s comprehensive neuropsychological assessment (the mean z-score of the component tests grouped within each of five cognitive domains). Dementia is the end-point for gathering this measure, as administering the full test battery becomes infeasible beyond that point. The diagnostic categories are represented by green circles (normal functioning), yellow triangles (mild cognitive impairment), or red squares (dementia). Controls show a pattern of relatively stable cognitive functioning over a wide age range, with only a few showing mild cognitive impairment, and one declining to dementia to date. While the younger Parkinson’s participants also show relatively stable functioning, a large proportion eventually develop mild cognitive impairment and many progress to dementia. A proportion, however, retains good functioning even into very old age. Understanding this heterogeneity in the course of disease is the main goal of the research programme. Figure available under an open CC-BY licence (MacAskill 2021a).

