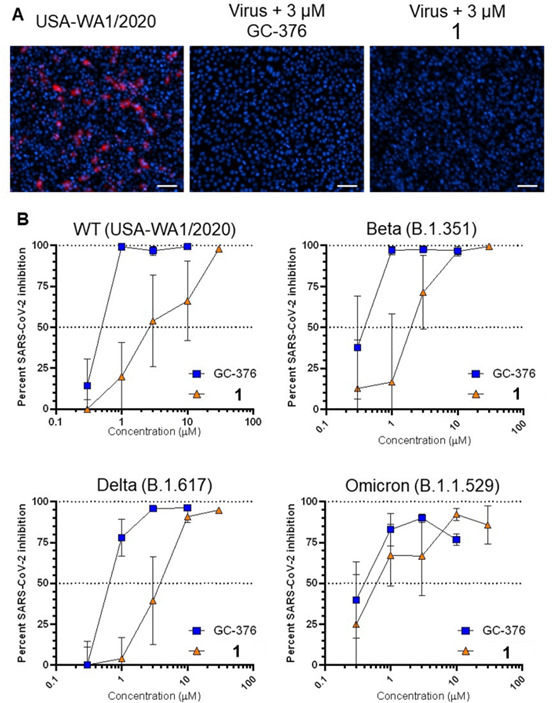
Fig 8.

Effects of compounds on viral nucleocapsid protein expression in Vero-E6 cells infected with SARS-CoV-2 VOC. (A) Respective immunostaining images of Vero-E6 cells infected with USA-WA1/2020 virus following 2-day incubation in the absence or presence of compounds. Red denotes viral nucleocapsid protein expression, and blue denotes cell nuclei. Scale bar, 100 µm. (B) Dose-response curves of GC-376 and 1 on viral nucleocapsid expression in Vero-E6 cells after 48-h infection with SARS-CoV-2 VOC, as measured by high-content imaging. Data are presented as percent virus inhibition relative to infected cells without drug.
